Q2 2025 Update for Stockholders
Q2 2025 Update for Stockholders
August 15, 2025
Dear BREIT Stockholder,
Before sharing this quarter’s update, we want to reflect upon the loss of our dear friend, partner and BREIT CEO, Wesley LePatner, in the tragic incident at our New York offices on July 28th. Wesley served as Chief Operating Officer and a Board member before becoming Chief Executive Officer earlier this year. Wesley’s brilliance, generosity, and impact on BREIT, Blackstone and beyond will never be forgotten, and we will continue to honor her powerful legacy.
On August 7, BREIT’s Board of Directors appointed Rob Harper Interim Chief Executive Officer. In addition to his role as Head of Asset Management for the Americas across Blackstone Real Estate, Rob has served as BREIT’s President/Co-President since August 2023 and previously served as BREIT’s Head of Asset Management from inception to August 2023. His deep experience and strong leadership make him a natural choice to guide us through this transition, and we are confident BREIT will continue to benefit from his steady hand.
We will also draw upon Frank Cohen’s extensive leadership experience as Board Chair and former CEO of BREIT during this period. BREIT’s acquisitions and capital markets activities have always been, and will continue to be, overseen by the Blackstone Real Estate U.S. leadership team including Nadeem Meghji, David Levine, Jacob Werner and Rob Harper and the Blackstone Real Estate Investment Committee, which is comprised of all Senior Managing Directors of Blackstone Real Estate as well as senior executives of Blackstone including Steve Schwarzman, Jon Gray, Michael Chae and Ken Caplan.
Amidst this tragedy, BREIT continues to stand strong
BREIT had a strong first half of the year, delivering a 3.1% return YTD (Class I).1 Since inception over eight years ago, BREIT has generated a 9.3% annualized net return (Class I), ~75% higher than publicly traded REITs and ~3x private real estate, as well as compelling and consistent historical distributions with potential tax benefits.1,2 In 2024, 96% of BREIT’s distribution was classified as a return of capital, bringing our 4.8% pre-tax Class I distribution rate to 7.5% on a tax-equivalent basis.4,5**
In times of market volatility and macroeconomic uncertainty, investors often seek stability in hard assets like private real estate, which can serve as a diversifying source of return with low correlation to the public markets.2 This combination of stability, along with both relative and absolute value, makes U.S. private real estate particularly compelling in today’s environment. While the S&P 500 has surged ~85% and corporate bonds have risen ~35% from their lows, private real estate has appreciated just 5%, highlighting its potential for meaningful future upside.6
We believe the key pillars of the real estate recovery—the ’3 C’s’—are firmly in place.
Collapsing Construction: In today’s higher rate environment, new construction starts in BREIT’s key sectors have fallen by two-thirds from 2022 levels, approaching the lowest levels in over 10 years.7,8 Tariffs are further tightening supply constraints, with warehouse construction costs nearly doubling since 2019.9
Capital Market Strength: Debt markets are showing clear signs of recovery, as spreads tighten to pre-tariff announcement levels and financing availability improves significantly. This renewed health in capital markets is reflected in CMBS issuance, which is up ~40% year-over-year, while the cost of capital has declined ~15% from last year and 40% from its 2023 peak.10,11
Cash Flow Growth: BREIT’s portfolio achieved 3% cash flow growth in the first half of this year, supported by strong demand tailwinds.3* With market rents across our portfolio averaging 11% higher than in-place rents, we believe BREIT is positioned for meaningful future cash flow growth.12
Together, these factors are driving the real estate recovery, fueling transaction activity, and supporting valuations. We believe these dynamics set the stage for continued strength, with significant upside potential as the recovery gains momentum.
High conviction portfolio of Blackstone Real Estate’s best ideas
Strong performance is ultimately driven by healthy real estate supply and demand fundamentals. BREIT is ~90% concentrated in rental housing, industrial and data centers, and ~70% concentrated in fast-growing Sunbelt markets with higher population, job and wage growth than the rest of the U.S.13 Our conviction in these sectors and markets is supported by long-term, secular megatrends that we believe will continue to generate outsized growth.
Rental Housing: Amidst continued macroeconomic uncertainty, we believe rental housing is the number one thing you want to own. Despite a temporary increase in apartment supply during the pandemic, substantially all of BREIT’s multifamily markets are now at or past peak new supply deliveries, while demand remains twice the long-term average.14,15 Homeownership costs have reached record highs, making owning a home 50% more expensive than renting, and first-time homebuyers in 2024 were 50% below historical averages.16,17 Meanwhile, housing starts remain stuck at 1960s levels, even as the population has nearly doubled, further contributing to the existing 4-5M U.S. housing shortfall.18,19 Across market cycles, rental housing has consistently proven resilient, and as we look ahead, we believe BREIT’s well-diversified portfolio across multifamily, student housing, single family rental housing and affordable housing is positioned to capitalize on these powerful tailwinds, with accelerating fundamentals in key sectors like multifamily.
Industrial: Growing demand for faster e-commerce deliveries and the reindustrialization of the U.S. are powerful tailwinds for BREIT’s industrial portfolio. Retailers now require 4x the warehouse space to meet 24-hour delivery expectations compared to 2-day delivery, fueling long-term demand for last-mile industrial assets.20 Additionally, ~$780B in U.S. manufacturing investments have been announced since 2021 and, according to JLL, every square foot of domestic manufacturing leads to 3-5 square feet of warehouse demand.21,22 BREIT is strategically positioned to capture this growth with a portfolio concentrated in high-performing markets like Atlanta, Dallas, and Chicago, key hubs for spillover demand.
Data Centers: Artificial intelligence is driving an unprecedented surge in demand for data centers, making this one of the most transformative and fastest-growing sectors across any asset class.23 Hyperscalers have increased their capital expenditures on digital infrastructure by ~4x since 2021, with spending projected to reach ~$390B in 2025.24 Data centers have been the top contributor to recent BREIT performance, and BREIT’s sector exposure has grown from 10% a year ago to 17% today. Blackstone’s data center platform, QTS, has been the engine behind this growth, achieving 10x growth in leased megawatts since its acquisition in 2021.25*** Year-to-date leasing volume in 2025 is up 11%, and QTS has a $25B+ development pipeline fully pre-leased to investment-grade tenants with 15+ year contracts.26,27*** With a land bank that can support $80B+ of potential development, QTS is positioned for significant expansion.28***
As we look ahead to the balance of the year, we are confident in BREIT’s potential to navigate the market and deliver for our investors.
Thank you for your trust, partnership and continued support.
Q2 2025 BREIT Highlights


*Rental Housing includes the following subsectors as a percent of real estate asset value: multifamily (20%, including senior housing, which accounts for <1%), student housing (9%), single family rental housing (9%, including manufactured housing, which accounts for 1%) and affordable housing (8%).
Key Portfolio Metrics
Performance Summary**
Total Returns (% Net of Fees)1
| Share Class | Q2 2025 | YTD | 1-Year | 3-Year | Annualized Inception to Date | |
|---|---|---|---|---|---|---|
| Class I | 1.2% | 3.1% | 2.7% | 1.9% | 9.3% | |
| Class D | (No Sales Load) (With Sales Load)35 | 1.1% -0.4% | 3.0% 1.4% | 2.4% 0.9% | 1.6% 1.1% | 9.0% 8.8% |
| Class S | (No Sales Load) (With Sales Load)35 | 1.0% -2.5% | 2.6% -0.8% | 1.8% -1.7% | 1.0% -0.1% | 8.3% 7.9% |
| Class T | (No Sales Load) (With Sales Load)35 | 1.0% -2.5% | 2.6% -0.8% | 1.8% -1.6% | 1.0% -0.1% | 8.5% 8.0% |
**Class D shares, Class S shares and Class T shares are no longer available for purchase in BREIT’s primary offering and only available to existing holders of such classes pursuant to BREIT’s distribution reinvestment plan. Class D-2 shares, Class S-2 shares, Class T-2 shares and Class I shares may be purchased in BREIT’s primary offering and through BREIT’s distribution reinvestment plan. As of the date hereof, there are no Class D-2, S-2 and T-2 shares outstanding.
Annualized Distribution Rates4
4.8%
Class I
4.6%
Class D
3.9%
Class S
4.0%
Class T
Download BREIT’s Q2 2025 Update

*Cash flow growth refers to same property net operating income (“NOI”) growth. Reflects BREIT’s year-over-year same property NOI growth for the six months ended June 30, 2025. See “Important Disclosure Information–Same Property NOI Growth”.
**Assumes that the investment in BREIT shares is not sold or redeemed. The tax-equivalent distribution rate would be up to 1.5% lower taking into account deferred capital gains tax that would be payable upon repurchase. See notes 4 and 5 for more information.
*** Reflects QTS’ development pipeline at 100% ownership interest. As of June 30, 2025, BREIT’s ownership interest in QTS was 35% and the QTS investment accounted for 16.1% of BREIT’s real estate asset value.
- Represents BREIT Class I shares. Please see page 3 for Q2’25, YTD, 1-Year, 3-Year and Inception to date (“ITD”) net returns. Q2’25 and YTD returns are not annualized. 3-Year and ITD returns for BREIT are annualized consistent with the IPA Practice Guideline 2018. January 1, 2017 reflects BREIT Class I’s inception date. Returns shown reflect the percent change in the NAV per share from the beginning of the applicable period, plus the amount of any distribution per share declared in the period. All returns shown assume reinvestment of distributions pursuant to BREIT’s distribution reinvestment plan, are derived from unaudited financial information, and are net of all BREIT expenses, including general and administrative expenses, transaction related expenses, management fees, performance participation allocation, and share class-specific fees, but exclude the impact of early repurchase deductions on the repurchase of shares that have been outstanding for less than one year. Class D shares, Class S shares and Class T shares were offered in BREIT’s primary offering but are currently only available to existing holders of such classes pursuant to BREIT’s distribution reinvestment plan. Class D-2 shares, Class S-2 shares, Class T-2 shares and Class I shares may be purchased in BREIT’s primary offering and through BREIT’s distribution reinvestment plan. The inception dates for the Class I, D, S and T shares are January 1, 2017, May 1, 2017, January 1, 2017 and June 1, 2017, respectively. As of the date hereof, there are no Class D-2, S-2 and T-2 shares outstanding. The returns have been prepared using unaudited data and valuations of the underlying investments in BREIT’s portfolio, which are estimates of fair value and form the basis for BREIT’s NAV. Valuations based upon unaudited reports from the underlying investments may be subject to later adjustments, may not correspond to realized value and may not accurately reflect the price at which assets could be liquidated. As return information is calculated based on NAV, return information presented will be impacted should the assumptions on which NAV was determined prove to be incorrect. Past performance does not predict future returns. Please see www.breit.com/performance for information on BREIT returns. After August 1, 2025, BREIT no longer offers Class D, S, and T shares in its primary offering, and instead offers Class D-2, S-2, and T-2 shares in its primary offering, which are expected to have the same monthly returns as Class D, S and T shares, respectively, on a going forward basis.
- Publicly traded REITs reflect the MSCI US REIT Index total return as of June 30, 2025. BREIT’s Class I inception date is January 1, 2017. Private real estate reflects the net total return as of June 30, 2025, which is the latest data available. During the period from January 1, 2017 to June 30, 2025, BREIT Class I’s annualized total net return of 9.3% was 2.6x the NFI-ODCE annualized total net return of 3.5% and 73% higher than the MSCI US REIT Index annualized total return of 5.3%. Private real estate reflects the NFI-ODCE index, which reflects total returns of various private real estate funds and should not be considered reflective of the performance of BREIT. Over the last 20 years (2005-2024), the S&P 500 and NFI-ODCE index have had a 0.0 correlation. BREIT does not trade on a national securities exchange, and therefore, is generally illiquid. The volatility and risk profile of the indices presented are likely to be materially different from that of BREIT, including that BREIT’s fees and expenses may be higher and BREIT shares are significantly less liquid than publicly traded companies. See “Important Disclosure Information–Index Definitions”.
- Cash flow growth refers to same property net operating income (“NOI”) growth. Reflects BREIT’s year-over-year same property NOI growth for the six month period ended June 30, 2025, which during that period was 3.2%. See page 8 and “Important Disclosure Information–Same Property NOI Growth”.
- Reflects the current month’s Class I distribution annualized and divided by the prior month’s net asset value, which is inclusive of all fees and expenses. Annualized distribution rate for the other share classes: Class D: 4.6%, Class S: 3.9% and Class T: 4.0%. Distributions are not guaranteed and may be funded from sources other than cash flow from operations, including, without limitation, borrowings, the sale of our assets, repayments of our real estate debt investments, ROC or offering proceeds, and advances or the deferral of fees and expenses. We have no limits on the amounts we may fund from such sources. Our inception to date cash flows from operating activities, along with inception to date net gains from investment realizations, have funded 100% of our distributions through June 30, 2025. See “Management’s Discussion and Analysis of Financial Condition and Results of Operations—Distributions” in BREIT’s Quarterly Report on Form 10-Q for more information. A portion of REIT ordinary income distributions may be tax deferred given the ability to characterize ordinary income as ROC. ROC distributions reduce the stockholder’s tax basis in the year the distribution is received, and generally defer taxes on that portion until the stockholder’s stock is sold via redemption. Upon redemption, the investor may be subject to higher capital gains taxes as a result of a lower cost basis due to the ROC distributions. Certain non-cash deductions, such as depreciation and amortization, lower the taxable income for REIT distributions. BREIT’s ROC in 2017, 2018, 2019, 2020, 2021, 2022, 2023 and 2024 was 66%, 97%, 90%, 100%, 92%, 94%, 85% and 96%, respectively. See “Important Disclosure Information”, including “Tax Information”.
- 7.5% tax-equivalent distribution rate assumes that the investment in BREIT shares is not sold or redeemed and reflects the pre-tax distribution rate an investor would need to receive from a theoretical investment to match the 4.7% after-tax distribution rate earned by a BREIT Class I stockholder based on BREIT’s 2024 ROC of 96%, if the distributions from the theoretical investment (i) were classified as ordinary income subject to tax at the top marginal tax rate of 37%, (ii) did not benefit from the 20% tax rate deduction and (iii) were not classified as ROC. The ordinary income tax rate could change in the future. Tax-equivalent distribution rate for the other share classes are as follows: Class D: 7.3%; Class S: 6.2%; and Class T: 6.3%. The tax-equivalent distribution rate would be reduced by 1.5%, 1.4%, 1.2% and 1.2% for Class I, D, S and T shares, respectively, taking into account deferred capital gains tax that would be payable upon redemption. This assumes a one-year holding period and includes the impact of deferred capital gains tax incurred in connection with a redemption of BREIT shares. Upon redemption, an investor is assumed to be subject to tax on all prior ROC distributions at the current maximum capital gains rate of 20%. The capital gains rate could change in the future. See “Important Disclosure Information–Tax Information” for more information.
- The S&P 500 reflects total gross return, as of July 31, 2025. S&P 500 “Low” refers to October 12, 2022. During the period from October 12, 2022 to July 31, 2025, the S&P 500 total gross return was 84.7%. Corporate bonds reflect the total return of the ICE BofA U.S. High Yield Index, as of July 31, 2025. Corporate bond “Low” refers to September 29, 2022. During the period from September 29, 2022 to July 31, 2025, Corporate bond total returns were 34.3%. Real estate values reflect Green Street Advisors, as of July 31, 2025. Reflects the Commercial Property Price Index for All Property, which captures the prices at which U.S. commercial real estate transactions are currently being negotiated and contracted. Real estate values “Low” refers to November 30, 2023. During the period from November 30, 2023 to July 31, 2025, real estate value total returns were 5.0%.
- RealPage Market Analytics, as of June 30, 2025. Represents change in annual starts as a percent of prior year end stock figures for the trailing twelve months as of Q2’25 compared to the year-ended 2022. Data reflects institutional-quality product across RealPage Market Analytics Top 150-tracked markets. As of June 30, 2025, the multifamily (including senior housing) and affordable housing sectors accounted for 20% and 8% of BREIT’s real estate asset value, respectively.
- CoStar, as of June 30, 2025. Represents change in annual starts as a percent of prior year-end stock figures for the trailing twelve months as of Q2’25 compared to the year-ended 2022. Data reflects the following Logistics and Flex subsectors per CoStar: Light Manufacturing, Manufacturing, Showroom, Bulk Warehouse, Distribution, Light Distribution, Light Industrial and Warehouse. As of June 30, 2025, the industrial sector accounted for 24% of BREIT’s real estate asset value.
- Blackstone Proprietary Data, as of March 31, 2025.
- Blackstone Proprietary Data and Green Street Advisors, as of June 30, 2025. Represents total U.S. SASB CMBS volume as of YTD period ended June 30, 2025 compared to YTD period ended June 30, 2024.
- Blackstone Proprietary Data, as of June 30, 2025. Represents estimated all-in borrowing costs for high-quality logistics transactions at ~65-70% avg. LTV. Base rate reflects 3-year SOFR swap rate (’23 wide as of October 18, 2023, and today as of June 30, 2025). Spread reflects weighted average spread across all rating tranches applied to estimated rating agency capital structures from each respective period. ’23 wide reflects peak base rate and spreads for representative BX SASB CMBS transactions in ’23. Jun’25 reflects all-in borrowing costs across SASB CMBS and bank balance sheet transactions There can be no assurance that financing costs will continue to decline and changes in this measure may have a negative impact on BREIT’s performance.
- Blackstone Proprietary Data, as of June 30, 2025. Represents our estimate of the average embedded rent growth potential of BREIT’s portfolio based on the difference between current in-place rents and current achievable market rents. See “Important Disclosure Information—Embedded Growth”. This is not a measure, or indicative, of overall portfolio performance or returns. Certain individual BREIT property sectors may have lower embedded rent growth potential, including rental housing, which accounts for 46% of BREIT’s real estate asset value as of June 30, 2025, and has an average 3% embedded rent growth potential as of June 30, 2025. BREIT’s portfolio has a 4.5-year weighted average lease length. Reflects real estate properties only, including unconsolidated properties, and does not include real estate debt investments. For a complete list of BREIT’s real estate investments (excluding equity in public and private real estate-related companies), visit www.breit.com/properties. Embedded rent growth will not directly correlate with increased performance or returns and is presented for illustrative purposes only and does not constitute forecasts. There can be no assurance that any such results will actually be achieved. A number of factors, including operating expenses as described in “Important Disclosure Information–Same Property NOI Growth”, will impact BREIT’s net performance or returns. Any expectations that in-place rents have the potential to increase are based on certain assumptions that may not be correct and on certain variables that may change.
- “Property Sector” weighting is measured as the asset value of real estate investments for each sector category divided by the asset value of all of BREIT’s real estate investments, excluding the value of any third-party interests in such real estate investments. Rental housing includes the following subsectors: multifamily (20%, including senior housing, which accounts for <1%), student housing (9%), single family rental housing (9%, including manufactured housing, which accounts for 1%) and affordable housing (8%). Please see the prospectus for more information on BREIT’s investments “Region Concentration” represents regions as defined by the National Council of Real Estate Investment Fiduciaries (“NCREIF”) and the weighting is measured as the asset value of real estate properties for each regional category divided by the asset value of all of BREIT’s real estate properties, excluding the value of any third-party interests in such real estate properties. “Sunbelt” reflects comparison between the South and West regions versus the rest of the United States as defined by NCREIF. Population growth reflects U.S. Bureau of Economic Analysis, as of March 31, 2025. Represents 5-year compound annual growth rate of population from mid-quarter Q1 2020 to mid-quarter Q1 2025. Job growth reflects U.S. Bureau of Labor Statistics data as of March 31, 2025. Represents 5-year compound annual growth rate of seasonally adjusted employees on nonfarm payrolls from March 2020 to March 2025. Wage growth reflects U.S. Bureau of Labor Statistics, as of December 31, 2024. Represents 5-year compound annual growth rate of employment-weighted average weekly wages from Q4 2019 to Q4 2024. Although a market may be a growth market as of the date of the publication of this material, demographics and trends may change and investors are cautioned on relying upon the data presented as there is no guarantee that historical trends will continue or that BREIT could benefit from such trends.
- RealPage Market Analytics as of June 30, 2025. Refers to ~97% of BREIT multifamily markets that are at or past peak supply as of June 30, 2025.
- RealPage Market Analytics as of June 30, 2025. Reflects average quarterly U.S. gross absorption in institutionally-managed multifamily properties tracked by RealPage. Long-term average refers to the ten years ended June 30, 2025. Today refers to the twelve months ended June 30, 2025.
- Blackstone Proprietary Data as of July 14, 2025. Represents the difference between monthly cost of ownership (including mortgage payments, taxes, maintenance costs, insurance, and HOA fees) and monthly rents for HPA and Tricon portfolios. Cost of ownership assumes 30-yr. fixed rate FHA mortgage, 3.5% amortized loan closing costs, and 3.5% down payment.
- National Association of Realtors. Represents total first-time home buyers in 2024 relative to the 20-year average.
- U.S. Census Bureau and Bureau of Economic Analysis, as of May 31, 2025. 60’s reflects average from 1960-1969. 2025 reflects May’25 TTM average.
- Brookings Institute, as of November 2024. Reflects the cumulative shortfall for total residential units (owned and rented) from 2006–2023.
- Blackstone Proprietary Data, as of June 30, 2024.
- Blackstone Proprietary Data, as of August 2025.
- JLL, as of January 2025. Refers to the incremental demand for industrial real estate driven by operational partners-suppliers, distributors and third-party logistics operators required for new manufacturing facilities.
- “Fastest-growing” reflects Blackstone Proprietary Data as of March 31, 2025 and datacenterHawk, as of March 31, 2025. “Fastest-growing” refers to numerical growth in leased megawatts since Q4 2019 of QTS relative to a peer set of the largest data center companies in the world. A copy of the source materials of such data will be provided upon request.
- Represents 2025 forecasted capital expenditure investments in data centers by Alphabet, Amazon, Meta, Microsoft and Oracle. Microsoft, AWS, Google, Meta per Morgan Stanley Equity Research and publicly reported figures. Oracle per RBC Equity Research and publicly reported figures.
- Based on leased megawatts at acquisition vs. June 30, 2025 (at 100% ownership). As of June 30, 2025, BREIT’s ownership in QTS was 35% and the QTS investment accounted for 16.1% of BREIT’s real estate asset value. There can be no assurance that these leases will commence on their current expected terms, or at all, and this information should not be considered an indication of future performance.
- Blackstone Proprietary Data as of June 30, 2025.
- Reflects total cost for committed development projects as of June 30, 2025, at 100% ownership. Development margin is estimated and calculated as the estimated asset value upon stabilization minus total development costs, divided by total development costs. Reflects signed leases and leases currently in negotiation. As of June 30, 2025, BREIT’s ownership in QTS was 35% and the QTS investment accounted for 16.1% of BREIT’s real estate asset value. There can be no assurance that these leases will commence on their current expected terms, or at all, and this information should not be considered an indication of future performance.
- Size of future pipeline as of June 30, 2025. Reflects cost estimate of developing data center projects on existing land bank acres and excludes committed development projects, at 100% ownership. This information is provided to illustrate the potential for additional development projects at QTS’s existing land bank acres, and there can be no assurance that any development projects will arise at these land bank acres. In addition, future land bank opportunities could be allocated to other Blackstone vehicles instead of to QTS or BREIT.
- Total asset value is measured as (i) the asset value of real estate investments (based on fair value), excluding any third party interests in such real estate investments, plus (ii) the equity in our real estate debt investments measured at fair value (defined as the asset value of our real estate debt investments less the financing on such investments), but excluding any other assets (such as cash or any other cash equivalents). The total asset value would be higher if such amounts were included and the value of our real estate debt investments was not decreased by the financing on such investments. “Real estate investments” include wholly-owned property investments, BREIT’s share of property investments held through joint ventures and equity in public and private real estate related companies. “Real estate debt investments” include BREIT’s investments in commercial mortgage-backed securities, residential mortgage-backed securities, mortgage loans and other debt secured by real estate and real estate related assets, as described in BREIT’s prospectus. The Consolidated GAAP Balance Sheet included in our annual and interim financial statements reflects the loan collateral underlying certain of our real estate debt investments on a gross basis. These amounts are excluded from our real estate debt investments as they do not reflect our economic interest in such assets.
- Number of properties reflects real estate investments only, including unconsolidated properties, and does not include real estate debt investments. Single family rental homes are not reflected in the number of properties.
- Occupancy is an important real estate metric because it measures the utilization of properties in the portfolio. Occupancy is weighted by the total value of all consolidated real estate properties, excluding our hospitality investments, and any third-party interests in such properties. For our industrial, net lease, data centers, office and retail investments, occupancy includes all leased square footage as of the date indicated. For our multifamily, student housing and affordable housing investments, occupancy is defined as the percentage of actual rent divided by gross potential rent (defined as actual rent for occupied units and market rent for vacant units) for the three months ended on the date indicated. For our single family rental housing investments, the occupancy rate includes occupied homes for the month ended on the date indicated. For our self storage, manufactured housing and senior living investments, the occupancy rate includes occupied square footage, occupied sites and occupied units, respectively, as of the date indicated. The average occupancy rate for our hospitality investments was 72% for the twelve months ended June 30, 2025 and includes paid occupied rooms. Hospitality investments owned less than 12 months are excluded from the average occupancy rate calculation. Unconsolidated investments are excluded from occupancy rate calculations.
- Our leverage ratio is measured by dividing (i) consolidated property-level and entity-level debt net of cash and loan-related restricted cash, by (ii) the asset value of real estate investments (measured using the greater of fair market value and cost) plus the equity in our settled real estate debt investments. Indebtedness incurred (i) in connection with funding a deposit in advance of the closing of an investment or (ii) as other working capital advances will not be included as part of the calculation above. The leverage ratio would be higher if the indebtedness on our real estate debt investments and the pro rata share of debt within our unconsolidated investments were taken into account. The use of leverage involves a high degree of financial risk and may increase the exposure of the investments to adverse economic factors.
- Percentage fixed-rate financing is measured by dividing (i) the sum of our consolidated fixed-rate debt, secured financings on investments in real estate debt, and the outstanding notional principal amount of corporate and consolidated interest rate swaps, by (ii) total consolidated debt outstanding inclusive of secured financings on investments in real estate debt.
- Investment allocation is measured as the asset value of each investment category (real estate investments or real estate debt investments) divided by the total asset value of all investment categories, excluding the value of any third party interests in such assets.
- Assumes payment of the full upfront sales charge at initial subscription (1.5% for Class D shares; 3.5% for Class S and Class T shares). The sales charge for Class D shares became effective May 1, 2018.
Important Disclosure Information
Past performance does not predict future returns. Financial data is estimated and unaudited. All figures as of June 30, 2025 unless otherwise noted. Opinions expressed reflect the current opinions of BREIT as of the date appearing in the materials only and are based on BREIT’s opinions of the current market environment, which is subject to change. Certain information contained in the materials discusses general market activity, industry or sector trends, or other broad-based economic, market or political conditions and should not be construed as research or investment advice.
The properties, sectors and geographies referenced herein do not represent all BREIT investments. The selected investment examples presented or referred to herein may not be representative of all transactions of a given type or of investments generally and are intended to be illustrative of the types of investments that have been made or may be made by BREIT in employing its investment strategies. It should not be assumed that BREIT’s investment in the properties identified and discussed herein were or will be profitable or that BREIT will make equally successful or comparable investments in the future. Please refer to https://www.breit.com/properties for a complete list of real estate investments (excluding equity in public and private real estate related companies).
Blackstone Proprietary Data. Certain information and data provided herein is based on Blackstone proprietary knowledge and data. Portfolio companies may provide proprietary market data to Blackstone Inc. (“Blackstone”), including about local market supply and demand conditions, current market rents and operating expenses, capital expenditures and valuations for multiple assets. Such proprietary market data is used by Blackstone to evaluate market trends as well as to underwrite potential and existing investments. While Blackstone currently believes that such information is reliable for purposes used herein, it is subject to change, and reflects Blackstone’s opinion as to whether the amount, nature and quality of the data is sufficient for the applicable conclusion, and no representations are made as to the accuracy or completeness thereof.
Embedded Growth. Embedded growth represents Blackstone’s expectations for growth based on its view of the current market environment taking into account rents that are currently below market rates and therefore have the potential to increase. These expectations are based on certain assumptions that may not be correct and on certain variables that may change, are presented for illustrative purposes only and do not constitute forecasts. There can be no assurance that any such results will actually be achieved.
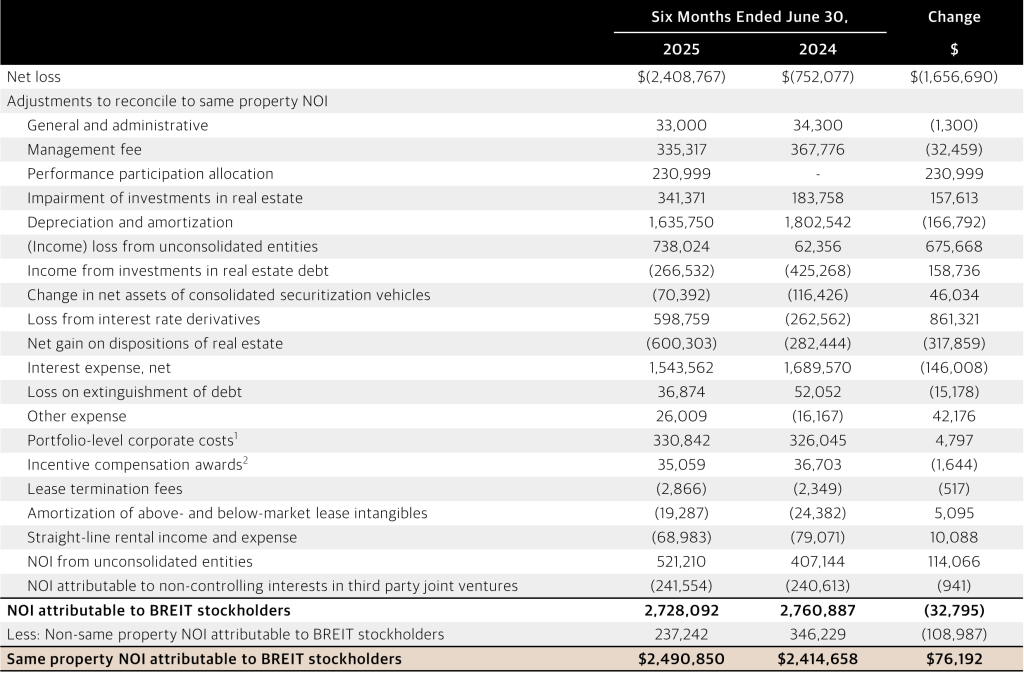
Same Property NOI Growth. Represents BREIT’s year-to-date same property NOI growth for the six months ended June 30, 2025 compared to the prior year. Net Operating Income (“NOI”) is a supplemental non-GAAP measure of BREIT’s property operating results that BREIT believes is meaningful because it enables management to evaluate the impact of occupancy, rents, leasing activity, and other controllable property operating results at BREIT’s real estate. BREIT defines NOI as operating revenues less operating expenses, which exclude (i) impairment of investments in real estate, (ii) depreciation and amortization, (iii) straight-line rental income and expense, (iv) amortization of above- and below-market lease intangibles, (v) amortization of accumulated unrealized gains on derivatives previously recognized in other comprehensive income, (vi) lease termination fees, (vii) portfolio-level corporate costs, (viii) other non-property related revenue and expense items such as (a) general and administrative expenses, (b) management fee, (c) performance participation allocation, (d) incentive compensation awards, (e) income (loss) from investments in real estate debt, (f) change in net assets of consolidated securitization vehicles, (g) income (loss) from interest rate derivatives, (h) net gain on dispositions of real estate, (i) interest expense, net, (j) loss on extinguishment of debt, (k) other income (expense), and (l) buyout costs and (ix) similar adjustments for NOI attributable to non-controlling interests and unconsolidated entities. BREIT evaluates BREIT’s consolidated results of operations on a same-property basis, which allows BREIT to analyze BREIT’s property operating results excluding acquisitions and dispositions during the periods under comparison. Properties in BREIT’s portfolio are considered same property if they were owned for the full periods presented, otherwise they are considered non-same property. Recently developed properties are not included in same property results until the properties have achieved stabilization for both full periods presented. BREIT defines stabilization for the property as the earlier of (i) achieving 90% occupancy, (ii) 12 months after receiving a certificate of occupancy, or (iii) for Data Centers, 12 months after receiving a certificate of occupancy and greater than 50% of its critical IT capacity has been built. Certain assets are excluded from same property results and are considered non-same property, including (i) properties held-for-sale, (ii) properties that are being redeveloped, (iii) properties identified for future sale, and (iv) interests in unconsolidated entities under contract for sale with hard deposit or other factors ensuring the buyer’s performance. We do not consider BREIT’s investments in the real estate debt segment or equity securities to be same property. For more information, please refer to BREIT’s Quarterly Report on Form 10-Q filed with the Securities and Exchange Commission on August 13, 2025 and the prospectus. Additionally, please refer to page 8 for a reconciliation GAAP loss to same property NOI for the six months ended June 30, 2025 and 2024.
Select Images. The selected images of certain BREIT investments in this presentation are provided for illustrative purposes only, are not representative of all BREIT investments of a given property type and are not representative of BREIT’s entire portfolio. It should not be assumed that BREIT’s investment in the properties identified and discussed herein were or will be profitable. Please refer to www.breit.com/properties for a complete list of BREIT’s real estate investments (excluding equity in public and private real estate related companies), including BREIT’s ownership interest in such properties.
Sponsor. This material makes reference to Blackstone, a premier global investment manager. The real estate group of Blackstone, Blackstone Real Estate, is BREIT’s sponsor and an affiliate of the BREIT Adviser. Information regarding Blackstone and Blackstone Real Estate is included to provide information regarding the experience of BREIT’s sponsor and its affiliates. An investment in BREIT is not an investment in BREIT’s sponsor or Blackstone as BREIT is a separate and distinct legal entity.
Tax Information. The tax information herein is provided for informational purposes only, is subject to material change, and should not be relied upon as a guarantee or prediction of tax effects. This material also does not constitute tax advice to, and should not be relied upon by, potential investors, who should consult their own tax advisors regarding the matters discussed herein and the tax consequences of an investment. A portion of REIT ordinary income distributions may be tax deferred given the ability to characterize ordinary income as Return of Capital (“ROC”). ROC distributions reduce the stockholder’s tax basis in the year the distribution is received, and generally defer taxes on that portion until the stockholder’s stock is sold via redemption. Upon redemption, the investor may be subject to higher capital gains taxes as a result of a lower cost basis due to the ROC distributions. Certain non-cash deductions, such as depreciation and amortization, lower the taxable income for REIT distributions. Investors should be aware that a REIT’s ROC percentage may vary significantly in a given year and, as a result, the impact of the tax law and any related advantage may vary significantly from year to year. The tax benefits are not applicable to capital gain dividends or certain qualified dividend income and are only available for qualified REITs. If BREIT did not qualify as a REIT, the tax benefit would be unavailable. BREIT’s board also has the authority to revoke its REIT election. There may be adverse legislative or regulatory tax changes and other investments may offer tax advantages without the set expiration. An accelerated depreciation schedule does not guarantee a profitable return on investment and ROC reduces the basis of the investment. While we currently believe that the estimations and assumptions referenced herein are reasonable under the circumstances, there is no guarantee that the conditions upon which such assumptions are based will materialize or are otherwise applicable. This information does not constitute a forecast, and all assumptions herein are subject to uncertainties, changes and other risks, any of which may cause the relevant actual, financial and other results to be materially different from the results expressed or implied by the information presented herein. No assurance, representation or warranty is made by any person that any of the estimations herein will be achieved, and no recipient of this example should rely on such estimations. Investors may also be subject to net investment income taxes of 3.8% and/or state income tax in their state of residence which would lower the after-tax distribution rate received by the investor.
Third Party Information. Certain information contained in this material has been obtained from sources outside Blackstone, which in certain cases have not been updated through the date hereof. While such information is believed to be reliable for purposes used herein, no representations are made as to the accuracy or completeness thereof and none of Blackstone, its funds, nor any of their affiliates takes any responsibility for, and has not independently verified, any such information. This information involves a number of assumptions and limitations, and you are cautioned not to give undue weight to these estimates.
Trends. There can be no assurances that any of the trends described herein will continue or will not reverse. Past events and trends do not imply, predict or guarantee, and are not necessarily indicative of, future events or results.
Use of Leverage. BREIT uses and expects to continue to use leverage. If returns on such investment exceed the costs of borrowing, investor returns will be enhanced. However, if returns do not exceed the costs of borrowing, BREIT performance will be depressed. This includes the potential for BREIT to suffer greater losses than it otherwise would have. The effect of leverage is that any losses will be magnified. The use of leverage involves a high degree of financial risk and will increase BREIT’s exposure to adverse economic factors such as rising interest rates, downturns in the economy or deteriorations in the condition of BREIT’s investments. This leverage may also subject BREIT and its investments to restrictive financial and operating covenants, which may limit flexibility in responding to changing business and economic conditions. For example, leveraged entities may be subject to restrictions on making interest payments and other distributions.
Index Definitions
An investment in BREIT is not a direct investment in real estate, and has material differences from a direct investment in real estate, including those related to fees and expenses, liquidity and tax treatment. BREIT’s share price is subject to less volatility because its per share NAV is based on the value of real estate assets it owns and is not subject to market pricing forces as are the prices of the asset classes represented by the indices presented. Although BREIT’s share price is subject to less volatility, BREIT shares are significantly less liquid than these asset classes, and are not immune to fluctuations. Private real estate is not traded on an exchange and will have less liquidity and price transparency. The value of private real estate may fluctuate and may be worth less than was initially paid for it.
The volatility and risk profile of the indices presented is likely to be materially different from that of BREIT including those related to fees and expenses, liquidity, safety, and tax features. In addition, the indices employ different investment guidelines and criteria than BREIT; as a result, the holdings in BREIT may differ significantly from the holdings of the securities that comprise the indices. The indices are not subject to fees or expenses, are meant to illustrate general market performance and it may not be possible to invest in the indices. The performance of the indices has not been selected to represent an appropriate benchmark to compare to BREIT’s performance, but rather is disclosed to allow for comparison of BREIT’s performance to that of well-known and widely recognized indices. A summary of the investment guidelines for the indices presented is available upon request. In the case of equity indices, performance of the indices reflects the reinvestment of dividends.
BREIT does not trade on a national securities exchange, and therefore, is generally illiquid. Your ability to redeem shares in BREIT through BREIT’s share repurchase plan may be limited, and fees associated with the sale of these products can be higher than other asset classes. In some cases, periodic distributions may be subsidized by borrowed funds and include a return of investor principal. This is in contrast to the distributions investors receive from large corporate stocks that trade on national exchanges, which are typically derived solely from earnings. Investors typically seek income from distributions over a period of years. Upon liquidation, ROC may be more or less than the original investment depending on the value of assets.
An investment in BREIT (i) differs from the Green Street Commercial Property Price Index in that such index represents various private real estate values with differing sector concentrations (ii) differs from high yield bonds and the ICE BofA U.S. High Yield Index in that private real estate investments are not fixed-rate debt instruments and such bonds represent debt issued by corporations across a variety of issuers with varying pricing, terms and conditions, (iii) differs from the MSCI U.S. REIT Index in that BREIT is not a publicly traded U.S. Equity REIT, (iv) differs from the NFI-ODCE in that such index represents various private real estate funds with differing terms and strategies, and (v) differs from equities and the S&P 500 Index in that private real estate investments are not large or mid cap stocks and are not publicly traded.
- The Green Street Commercial Property Price Index (“CPPI”) is a value-weighted time series of unleveraged U.S. commercial property values with an inception date of December 31, 1997. CPPI is shown to illustrate general market trends for informational purposes only, does not represent any specific investment and does not reflect how BREIT has performed or will perform in the future. The index captures the prices at which commercial real estate transactions are currently being negotiated and contracted, measuring price changes across select property types covered by Green Street Advisors. All Property Sector weights: retail (20%), apartments (15%), health care (15%), industrial (12.5%), office (12.5%), lodging (7.5%), data center (5%), net lease (5%), self-storage (5%), and manufactured home park (2.5%). Apartments refers to multifamily, lodging refers to hospitality.
- The ICE BofA U.S. High Yield Index is a capitalization-weighted index that measures the performance of USD-denominated, below investment grade rated, fixed rate corporate debt publicly issued in the US domestic market. An investment in high-yield corporate bonds is generally considered to be a less risky investment than private real estate.
- The MSCI U.S. REIT Index is a free float-adjusted market capitalization index that is comprised of equity REITs. The index is based on the MSCI USA Investable Market Index (IMI), its parent index, which captures large, mid and small cap securities. It represents about 99% of the U.S. REIT universe. The index is calculated with dividends reinvested on a daily basis.
- The NFI-ODCE is a capitalization-weighted, gross of fees, time-weighted return index with an inception date of December 31, 1977. Published reports also contain equal-weighted and net of fees information. Open-end funds are generally defined as infinite-life vehicles consisting of multiple investors who have the ability to enter or exit the fund on a periodic basis, subject to contribution and/or redemption requests, thereby providing a degree of potential investment liquidity. The term diversified core equity typically reflects lower risk investment strategies utilizing low leverage and is generally represented by equity ownership positions in stable U.S. operating properties diversified across regions and property types. While funds used in the NFI-ODCE have characteristics that differ from BREIT (including differing management fees and leverage), BREIT’s management feels that the NFI-ODCE is an appropriate and accepted index for the purpose of evaluating the total returns of direct real estate funds. Comparisons shown are for illustrative purposes only and do not represent specific investments. Investors cannot invest in this index. BREIT has the ability to utilize higher leverage than is allowed for the funds in the NFI-ODCE, which could increase BREIT’s volatility relative to the index. Additionally, an investment in BREIT is subject to certain fees that are not contemplated in the NFI-ODCE.
- The S&P 500 Index is a market capitalization-weighted index that includes 500 stocks representing all major industries. Returns are denominated in U.S. dollars. The S&P 500 Index is a proxy of the performance of the broad U.S. economy through changes in aggregate market value. The S&P 500 Index is a widely used barometer of U.S. stock market performance. The key risk of the S&P 500 Index is the volatility that comes with exposure to the stock market.
Forward-Looking Statement Disclosure
This material contains forward-looking statements within the meaning of the federal securities laws and the Private Securities Litigation Reform Act of 1995. These forward-looking statements can be identified by the use of forward-looking terminology such as “outlook,” “indicator,” “believes,” “expects,” “potential,” “continues,” “identified,” “may,” “will,” “could,” “should,” “seeks,” “approximately,” “predicts,” “intends,” “plans,” “estimates,” “anticipates”, “confident,” “conviction” or other similar words or the negatives thereof. These may include financial estimates and their underlying assumptions, statements about plans, objectives, intentions, and expectations with respect to positioning, including the impact of macroeconomic trends and market forces, future operations, repurchases, acquisitions, future performance and statements regarding identified but not yet closed acquisitions or dispositions and pre-leased but not yet occupied development properties. Such forward-looking statements are inherently subject to various risks and uncertainties. Accordingly, there are or will be important factors that could cause actual outcomes or results to differ materially from those indicated in such statements. We believe these factors include but are not limited to those described under the section entitled “Risk Factors” in BREIT’s prospectus and annual report for the most recent fiscal year, and any such updated factors included in BREIT’s periodic filings with the SEC, which are accessible on the SEC’s website at www.sec.gov. These factors should not be construed as exhaustive and should be read in conjunction with the other cautionary statements that are included in this document (or BREIT’s public filings). Except as otherwise required by federal securities laws, we undertake no obligation to publicly update or revise any forward-looking statements, whether as a result of new information, future developments or otherwise.
The following table reconciles GAAP net loss to same property NOI for the six months ended June 30, 2025 and 2024. Same property NOI growth for the six months ended June 30, 2025 was 3% ($ in thousands).