
Q1 2023 Update for Stockholders
Q1 2023 Update for Stockholders
April 25, 2023
Dear BREIT Stockholder,
We built BREIT as an all-weather strategy designed to deliver strong performance across market cycles. We are proud that BREIT has generated a +12% annualized net return since inception in January 2017, nearly triple the return of the publicly traded REITs.1,2 While our first quarter performance of -0.5% was impacted by a reduction in the value of our interest rate hedges, BREIT remains well positioned with a real estate portfolio concentrated in high growth regions and sectors which we believe benefit from strong demand, limited supply and secular and demographic tailwinds.1 This thoughtful market and sector selection powered strong cash flow growth of an estimated +9% in the first quarter, considerably outpacing inflation.3,4
Seeing around corners and positioning our portfolio where we see the best opportunities is at the core of Blackstone Real Estate’s investment approach. In today’s environment, you can’t paint real estate with a broad brush. We are seeing significant dispersion across real estate sectors. Challenges in office have been widely reported as hybrid and remote work policies continue to pressure the sector. That is one of the reasons BREIT has virtually no exposure to commodity office. Meanwhile, industrial and data center assets are experiencing strong demand and rent growth as the ongoing shift to e-commerce, realignment of supply chains, and explosive growth in data from cloud computing and artificial intelligence fuel performance.5 Even within a sector like rental housing, sub-sector and asset selection is critical.
Where you invest matters: Historically strong fundamentals, declining supply and built-in growth potential reinforce our conviction in BREIT.
All this serves as a stark reminder that where you invest matters. We believe BREIT is well positioned across this spectrum of leaders and laggards with over 80% concentration in rental housing, industrial, and data centers.6 Our industrial portfolio continues to benefit from broad based demand with leases signed at 37% higher rents than expiring leases in Q1 2023.7 BREIT’s data center portfolio company, QTS, signed more leases last year than in the past 15 years prior to our acquisition combined.8 Our rental housing portfolio is focused on sub-sectors and regions with stronger fundamentals compared to the national average.9 While national multifamily rent growth has moderated from last year’s record highs, BREIT’s portfolio is not average and we are consistently signing multifamily leases at 4% higher rents than expiring leases.10 Nearly half of BREIT’s rental housing portfolio is concentrated in student housing, affordable housing and single family rental housing, where market rent growth remains outsized at 9%, 9% and 6%, respectively.6,11 In addition to our strong sector selection, we’ve also picked the right markets. BREIT is more than 70% concentrated in the Southern and Western United States, with Florida and Texas representing BREIT’s two largest state concentrations.12 Across BREIT’s entire portfolio, market rents grew 8% year-over-year in March and, in multifamily and industrial specifically, market rents remain 17% higher than BREIT’s in-place rents, which we believe creates significant embedded rent growth potential.11,13
We anticipated an elevated interest rate environment and sought to protect our portfolio by proactively locking in low rates on approximately 90% of BREIT’s liabilities.14 This decision was critical – the 10-year Treasury Yield has risen from 1.5% in December 2021 to 3.5% today and our interest rate hedges have helped mitigate the impact of rising rates and generated $3.4B of value.15,16 In an environment of increasingly scarce financing, BREIT has a strong balance sheet with modest leverage of 45% and less than 1% of our debt maturing in 2023.17,18 Stress in the banking sector in March was a sober reminder to expect the unexpected and BREIT’s proactive balance sheet and counterparty management helped ensure we were on solid footing. Looking ahead, we believe a silver lining of the recent regional bank failures will be reduced availability of construction financing, given their role as meaningful lenders in the space. We believe this will further constrain already limited supply in our core sectors, strengthening pricing power for the assets BREIT owns.
Moments of volatility create dislocation and opportunity for seasoned investors and BREIT benefits from Blackstone Real Estate’s 30+ year track record of successfully navigating market cycles, disruptions and volatility.19 We remain confident that BREIT’s disciplined approach will continue to deliver for our investors in the current environment.
Thank you for your partnership and your continued trust in BREIT.

Q1 2023 BREIT Highlights
Property Sector6
83%
Concentrated in Rental Housing, Industrial and Data Centers
| Rental Housing | 56% |
| Industrial | 23% |
| Net Lease | 6% |
| Data Centers | 4% |
| Hospitality | 3% |
| Self Storage | 3% |
| Retail | 3% |
| Office | 2% |
Region Concentration12
71%
Concentrated in the South and West regions of the U.S.
| South | 39% |
| West | 32% |
| East | 17% |
| Midwest | 9% |
| Non-U.S. | 3% |
Key Portfolio Metrics
Performance Summary
Total Returns (% Net of Fees)1
| Share Class | Sales Load | Year to Date | 1-Year | 3-Year Annualized | Inception to Date Annualized |
|---|---|---|---|---|---|
| Class I | -0.5% | 2.9% | 17.5% | 11.9% | |
| Class D | (No Sales Load) (With Sales Load)24 | -0.6% -2.1% | 2.6% 1.0% | 17.0% 16.4% | 11.8% 11.5% |
| Class S | (No Sales Load) (With Sales Load)24 | -0.8% -4.1% | 2.0% -1.5% | 16.4% 15.1% | 11.0% 10.4% |
| Class T | (No Sales Load) (With Sales Load)24 | -0.7% -4.1% | 1.9% -1.5% | 16.7% 15.3% | 11.3% 10.7% |
Distribution Rate25
| Share Class | Annualized |
|---|---|
| Class I | 4.5% |
| Class D | 4.4% |
| Class S | 3.7% |
| Class T | 3.7% |
* Rental Housing includes the following subsectors as a percent of Real Estate TAV: multifamily (36%, including affordable housing, which represents 9%), student housing (10%), single family rental (8%), manufactured housing (1%) and senior housing (<1%).
Download BREIT’s Q1 2023 Update
Past performance does not guarantee future results. Financial data is estimated and unaudited. All figures as of March 31, 2023 unless otherwise noted. Opinions expressed reflect the current opinions of BREIT as of the date appearing in the materials only and are based on BREIT’s opinions of the current market environment, which is subject to change. Certain information contained in the materials discusses general market activity, industry or sector trends, or other broad-based economic, market or political conditions and should not be construed as research or investment advice.
- Represents Class I shares. Please refer to the above for performance for BREIT’s other share classes. Returns shown reflect the percent change in the NAV per share from the beginning of the applicable period, plus the amount of any distribution per share declared in the period. All returns shown assume reinvestment of distributions pursuant to BREIT’s distribution reinvestment plan, are derived from unaudited financial information, and are net of all BREIT expenses, including general and administrative expenses, transaction-related expenses, management fees, performance participation allocation, and share class-specific fees, but exclude the impact of early repurchase deductions on the repurchase of shares that have been outstanding for less than one year. The inception dates for the Class I, D, S and T shares are January 1, 2017, May 1, 2017, January 1, 2017 and June 1, 2017, respectively. 1-year and 3-year refer to the twelve and thirty-six months, respectively, ended March 31, 2023. The returns have been prepared using unaudited data and valuations of the underlying investments in BREIT’s portfolio, which are estimates of fair value and form the basis for BREIT’s NAV. Valuations based upon unaudited reports from the underlying investments may be subject to later adjustments, may not correspond to realized value and may not accurately reflect the price at which assets could be liquidated. As return information is calculated based on NAV, return information presented will be impacted should the assumptions on which NAV was determined prove to be different. Past performance is not necessarily indicative of future results. 3-year and inception to date (“ITD”) returns are annualized consistent with the IPA Practice Guideline 2018. Year to date returns are not annualized.
- Publicly traded REITs reflect the MSCI U.S. REIT Index total gross return as of March 31, 2023. BREIT’s Class I inception date is January 1, 2017. During the period from January 1, 2017 to March 31, 2023, BREIT Class I’s net return was 2.8x greater than the gross returns of the MSCI U.S. REIT Index. See “Index Definitions”.
- Represents BREIT’s preliminary estimated year to date same property NOI growth for the period ended March 31, 2023 compared to the same period in the prior year (based on the midpoint of the preliminary estimated range of same property NOI). This data is not a comprehensive statement of our financial results for the three months ended March 31, 2023, and our actual results may differ materially from this preliminary estimated data. Net Operating Income (“NOI”) is a supplemental non-generally accepted accounting principles (“GAAP”) measure of our property operating results that we believe is meaningful because it enables management to evaluate the impact of occupancy, rents, leasing activity and other controllable property operating results at our real estate. We define NOI as operating revenues less operating expenses, which exclude (i) impairment of investments in real estate, (ii) depreciation and amortization, (iii) straight-line rental income and expense, (iv) amortization of above- and below-market lease intangibles, (v) lease termination fees, (vi) property expenses not core to the operations of such properties, and (vii) other non-property related revenue and expense items such as (a) general and administrative expenses, (b) management fee paid to the Adviser, (c) performance participation allocation paid to the Special Limited Partner, (d) incentive compensation awards, (e) income (loss) from investments in real estate debt, (f) change in net assets of consolidated securitization vehicles, (g) income from equity securities and interest rate derivatives, (h) net gain (loss) on dispositions of real estate, (i) interest expense, (j) gain (loss) on extinguishment of debt, (k) other income (expense), and (l) similar adjustments for NOI attributable to non-controlling interests and unconsolidated entities. We evaluate our consolidated results of operations on a same property basis, which allows us to analyze our property operating results excluding acquisitions and dispositions during the periods under comparison. Properties in our portfolio are considered same property if they were owned for the full periods presented, otherwise they are considered non-same property. Recently developed properties are not included in same property results until the properties have achieved stabilization for both full periods presented. Properties held for sale, properties that are being re-developed, and interests in unconsolidated entities under contract of sale with hard deposit or other factors ensuring the buyer’s performance are excluded from same property results and are considered non-same property. We do not consider our investments in the real estate debt segment or equity securities to be same property. For more information, please refer to BREIT’s Current Report on Form 8-K filed with the Securities and Exchange Commission on April 14, 2023 and the prospectus. Additionally, please refer to the below for a reconciliation of estimated GAAP net (loss) income to same property NOI for the year to date periods ended March 31, 2023 and 2022.
- Inflation reflects U.S. Bureau of Labor Statistics data and represents the Consumer Price Index, which measures changes in the prices paid by urban consumers for a representative basket of goods and services year-over-year as of March 31, 2023. NOI growth may not be correlated to or continue to keep pace with inflation.
- Strong fundamentals, demand and rent growth reflect Green Street Advisors latest sector updates available, as of March 8, 2023.
- “Property Sector Concentration” weighting is measured as the asset value of real estate investments for each sector category (rental housing, industrial, net lease, data centers, hospitality, self storage, office, retail) divided by the total asset value of all real estate investments, excluding the value of any third-party interests in such real estate investments (“Real Estate TAV”). The following sectors each have subsectors comprising over 1.0% of Real Estate TAV. Rental housing: multifamily (36%, including affordable housing, which accounts for 9%), student housing (10%), single family rental housing (8%) and manufactured housing (1%); industrial: warehouses (22%); and hospitality: select service hotels (2%). Please see the prospectus for more information on BREIT’s investments.
- Blackstone Proprietary Data, as of March 31, 2023. Represents Q1 2023 leasing spreads in BREIT’s industrial portfolio and compares new or renewal rents to prior rents or expiring rents, as applicable.
- Blackstone Proprietary Data, as of December 31, 2022. Reflects QTS signed net new leasing in 2022 compared to total net new leasing between 2006 and 2020. As of December 31, 2022, BREIT’s ownership interest in QTS was 33.4% and the QTS investment accounted for 2.5% of BREIT’s real estate asset value.
- Reflects comparison between the South and West regions versus the rest of the United States as defined by the National Council of Real Estate Investment Fiduciaries (“NCREIF”). Population growth reflects U.S. Bureau of Economic Analysis, as of June 22, 2022. Represents 5-year compound annual growth rate of population from mid-quarter Q1 2017 to mid-quarter Q1 2022. Job growth reflects U.S. Bureau of Labor Statistics data as of September 16, 2022. Represents 5-year compound annual growth rate of seasonally adjusted employees on nonfarm payrolls from August 2017 to August 2022. Wage growth reflects U.S. Bureau of Labor Statistics, as of August 24, 2022. Represents 5-year compound annual growth rate of employment-weighted average weekly wages from Q1 2017 to Q1 2022.
- Blackstone Proprietary Data, as of March 31, 2023. Reflects average leasing spreads and represents new or renewal executed leases in BREIT’s multifamily portfolio (excluding affordable housing).
- Reflects year-over-year market rent growth in BREIT’s multifamily, student housing, single family rental housing, manufactured housing, senior housing, industrial, net lease, data centers, self storage, hospitality, retail and office sectors, weighted by BREIT’s real estate asset value in each sector. Multifamily (excluding affordable housing) reflects Axiometrics data as of March 31, 2023 and represents 3% effective market rent growth in BREIT’s markets weighted by unit count. Affordable Housing reflects Blackstone Proprietary Data as of April 7, 2023 and represents 9% estimated increase in rents for 2023 based on expectations of market/legal rent growth. Student housing reflects Blackstone Proprietary Data as of March 31, 2023 and represents 9% increase in rents for 2023-24 academic year compared to 2022-23 academic year based on 74% preleasing to date; assumes current asking rents are achieved for the remainder of the lease-up, of which there can be no assurance, and this information should not be considered an indication of future performance. Single family rental housing reflects Blackstone Proprietary Data as of March 31, 2023 and represents 6% leasing spreads, comparing new or renewal rents to prior rents or expiring rents, as applicable. Manufactured housing reflects Blackstone Proprietary Data as of March 31, 2023 and represents 7% rent increases for renewal notices sent through March 31, 2023 for 71% of BREIT’s portfolio and estimated rent increase for the remainder of 2023, of which there can be no assurance, and this information should not be considered an indication of future performance. Senior housing reflects Blackstone Proprietary Data as of March 31, 2023 and represents leasing spreads and compares new or renewal rents to prior rents or expiring rents. Industrial reflects Blackstone Proprietary Data as of March 31, 2023 and represents 12% market rent growth in BREIT’s U.S. industrial markets weighted by same property square footage at BREIT’s share. Net lease reflects Blackstone Proprietary Data as of December 31, 2022 and represents 11% year-over-year increase in market rent based on estimated run-rate EBITDAR and market rent coverage ratio for BREIT properties. Data Centers reflect datacenter Hawk data and represent 15% average hyperscale pricing increase in BREIT’s QTS Data Centers markets between December 31, 2021 and December 31, 2022 weighted by megawatts at BREIT’s share. Self Storage reflects Blackstone Proprietary Data as of March 31, 2023 and represents 11% market rent growth on new and renewal leases. Hospitality reflects Blackstone Proprietary Data as of March 31, 2023 and represents 7% average daily rate (“ADR”) growth. Retail reflects Blackstone Proprietary Data as of December 31, 2022 and represents estimated 5% market rent growth in BREIT’s markets. Office reflects Blackstone Proprietary Data as of December 31, 2022 and represents 4% market rent growth in BREIT’s markets.
- “Region Concentration” represents regions as defined by NCREIF and the weighting is measured as the asset value of real estate properties and unconsolidated property investments for each regional category (South, West, East, Midwest, Non-U.S.) divided by the total asset value of all (1) real estate properties, excluding the value of any third-party interests in such real estate properties, and (2) unconsolidated property investments. “Non-U.S.” reflects investments in Europe and Canada. Our portfolio is currently concentrated in certain industries and geographies, and, as a consequence, our aggregate return may be substantially affected by adverse economic or business conditions affecting that particular type of asset or geography. The select markets that are named represent BREIT’s largest two states by portfolio weighting. BREIT is invested in additional states which are not named above.
- As of March 31, 2023. Represents our estimate of the embedded growth potential between BREIT’s in-place multifamily and industrial portfolio rents and achievable market rents. We estimate that BREIT’s multifamily (excluding affordable housing) in-place rent roll has a 2% embedded growth potential and that BREIT’s industrial in-place rent roll has a 33% embedded growth potential. Reflects Blackstone Proprietary Data. Does not represent the entirety of BREIT’s portfolio and is not a measure, or indicative, of overall portfolio performance or returns. Other BREIT property sectors may have lower embedded growth potential. Any expectations that in-place rents have the potential to increase are based on certain assumptions that may not be correct and on certain variables that may change, are presented for illustrative purposes only and do not constitute forecasts. There can be no assurance that any such results will actually be achieved. Embedded rent growth will not directly correlate with increased returns. A number of factors, including operating expenses as described in Note 3 will impact BREIT’s net returns and performance. BREIT’s industrial assets have a 4.4-year weighted average lease length and BREIT’s rental housing assets have an approximately 0.5-year weighted average lease length. Reflects real estate properties only, including unconsolidated properties, and does not include real estate debt investments. For a complete list of BREIT’s real estate investments (excluding equity in public and private real estate-related companies), visit www.breit.com/properties. As of March 31, 2023, the multifamily (excluding affordable housing) sector accounted for 27% of BREIT’s real estate asset value and the industrial sector accounted for 23% of BREIT’s real estate asset value.
- As of March 31, 2023. 91% fixed rate financing is measured by dividing (i) the sum of our consolidated fixed rate debt, secured financings on investments in real estate debt with matched underlying interest rate exposure, and the outstanding notional principal amount of corporate and consolidated interest rate swaps, by (ii) total consolidated debt outstanding.
- Department of the Treasury, as of March 31, 2023. December 2021 refers to December 31, 2021. Today refers to March 31, 2023.
- Blackstone Proprietary Data, as of March 31, 2023. Value increases from BREIT’s fixed rate liabilities and corporate and real estate interest rate hedges are $3.4 billion from January 1, 2022 to March 31, 2023. Excludes value associated with floating rate debt and interest rate swaps against debt investments.
- As of March 31, 2023. Our leverage ratio is measured by dividing (i) consolidated property-level and entity-level debt net of cash and loan-related restricted cash, by (ii) the asset value of real estate investments (measured using the greater of fair market value and cost) plus the equity in our settled real estate debt investments. Indebtedness incurred (i) in connection with funding a deposit in advance of the closing of an investment or (ii) as other working capital advances will not be included as part of the calculation above. The leverage ratio would be higher if the indebtedness on our real estate debt investments and the pro rata share of debt within our unconsolidated investments were taken into account. The use of leverage involves a high degree of financial risk and may increase the exposure of the investments to adverse economic factors.
- As of March 31, 2023. Reflects percentage of BREIT’s property level and entity level debt maturing in 2023.
- This material makes reference to Blackstone, a premier global investment manager. The real estate group of Blackstone, Blackstone Real Estate, is BREIT’s sponsor and an affiliate of the BREIT Adviser. Information regarding Blackstone and Blackstone Real Estate is included to provide information regarding the experience of BREIT’s sponsor and its affiliates. An investment in BREIT is not an investment in BREIT’s sponsor or Blackstone as BREIT is a separate and distinct legal entity.
- Total asset value is measured as (1) the asset value of real estate investments (based on fair value), excluding any third-party interests in such real estate investments, plus (2) the equity in our real estate debt investments measured at fair value (defined as the asset value of our real estate debt investments less the financing on such investments), but excluding any other assets (such as cash or any other cash equivalents). The total asset value would be higher if such amounts were included and the value of our real estate debt investments was not decreased by the financing on such investments. “Real estate investments” include wholly owned property investments, BREIT‘s share of property investments held through joint ventures and equity in public and private real estate-related companies. “Real estate debt investments” include BREIT‘s investments in commercial mortgage-backed securities, residential mortgage-backed securities, mortgage loans and other debt secured by real estate and real estate related assets, as described in BREIT‘s prospectus. The Consolidated GAAP Balance Sheet included in our annual and interim financial statements reflects the loan collateral underlying certain of our real estate debt investments on a gross basis. These amounts are excluded from our real estate debt investments as they do not reflect our economic interest in such assets.
- Number of properties reflects real estate investments only, including unconsolidated properties, and does not include real estate debt investments Single family rental homes are not reflected in the number of properties.
- Occupancy is an important real estate metric because it measures the utilization of properties in the portfolio. Occupancy is weighted by the total value of all consolidated real estate properties, excluding our hospitality investments, and any third party interests in such properties. For our industrial, data center, retail and office investments, occupancy includes all leased square footage as of the date indicated. For our multifamily and student housing investments, occupancy is defined as the percentage of actual rent divided by gross potential rent (defined as actual rent for occupied units and market rent for vacant units) for the three months ended on the date indicated. For our net lease investments, occupancy includes leased properties as of the date indicated. For our single-family rental housing investments, the occupancy rate includes occupied homes for the three months ended on the date indicated. For our self storage, manufactured housing and senior living investments, the occupancy rate includes occupied square footage, occupied sites and occupied units, respectively, as of the date indicated. The average occupancy rate for our hospitality investments was 70% for the twelve months ended December 31, 2022. Hospitality investments owned less than twelve months are excluded from the average occupancy rate calculation.
- “Investment Allocation” is measured as the asset value of each investment category (real estate investments or real estate debt investments) divided by the total asset value of all investment categories, excluding the value of any third-party interests in such assets.
- Assumes payment of the full upfront sales charge at initial subscription (1.5%for Class D shares; 3.5% for Class S and Class T shares).
- Annualized distribution rates for all BREIT share classes can be found above. Reflects the current month’s distribution annualized and divided by the prior month’s NAV, which is inclusive of all fees and expenses. All distribution rates shown are historical. BREIT has delivered 73, 71, 73 and 70 months of consecutive distributions for the Class I, D, S and T shares, respectively. Distributions are not guaranteed and may be funded from sources other than cash flow from operations, including, without limitation borrowings, the sale of our assets, repayments of our real estate debt investments, return of capital or offering proceeds, and advances or the deferral of fees and expenses. We have no limits on the amounts we may fund from such sources. As of December 31, 2022, 100% of inception to date distributions were funded from cash flows from operations.
Important Disclosure Information
Blackstone Proprietary Data. Certain information and data provided herein is based on Blackstone proprietary knowledge and data. Portfolio companies may provide proprietary market data to Blackstone, including about local market supply and demand conditions, current market rents and operating expenses, capital expenditures and valuations for multiple assets. Such proprietary market data is used by Blackstone to evaluate market trends as well as to underwrite potential and existing investments. While Blackstone currently believes that such information is reliable for purposes used herein, it is subject to change, and reflects Blackstone’s opinion as to whether the amount, nature and quality of the data is sufficient for the applicable conclusion, and no representations are made as to the accuracy or completeness thereof.
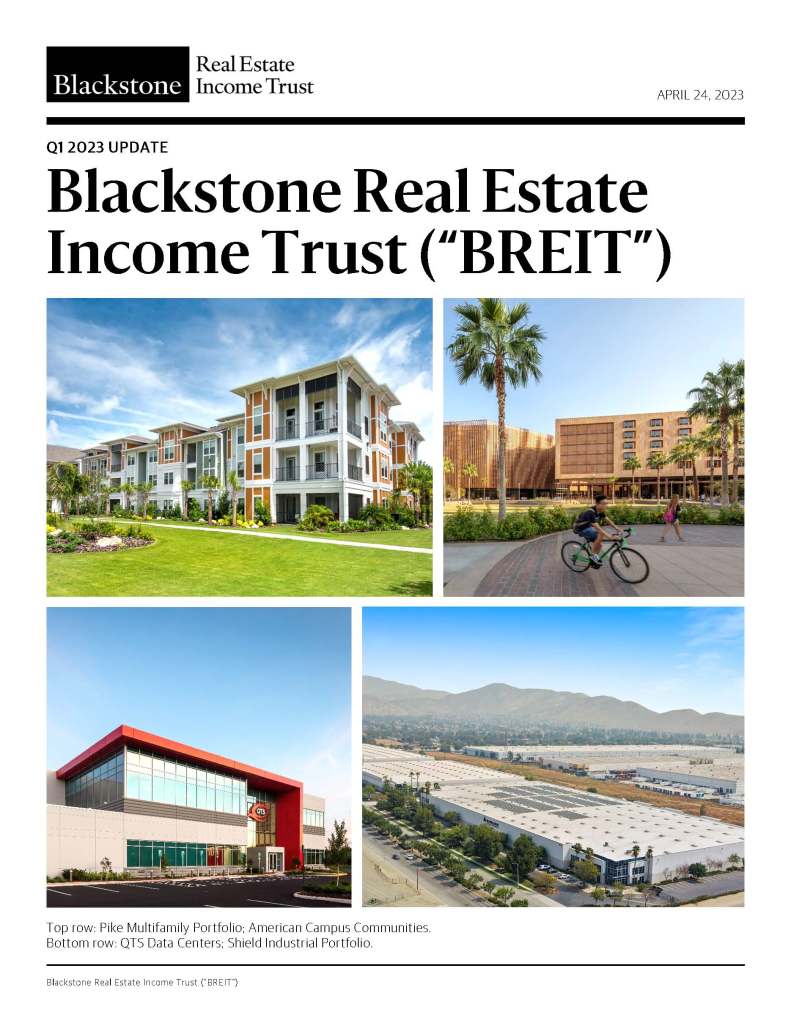
Select Images. The selected images of certain BREIT investments in this presentation are provided for illustrative purposes only, are not representative of all BREIT investments of a given property type and are not representative of BREIT’s entire portfolio. It should not be assumed that BREIT’s investment in the properties identified and discussed herein were or will be profitable. Please refer to www.breit.com/properties for a complete list of BREIT’s real estate investments (excluding equity in public and private real estate related companies), including BREIT’s ownership interest in such properties.
Third Party Information. Certain information contained in this material has been obtained from sources outside Blackstone, which in certain cases have not been updated through the date hereof. While such information is believed to be reliable for purposes used herein, no representations are made as to the accuracy or completeness thereof and none of Blackstone, its funds, nor any of their affiliates takes any responsibility for, and has not independently verified, any such information.
Trends. There can be no assurances that any of the trends described herein will continue or will not reverse. Past events and trends do not imply, predict or guarantee, and are not necessarily indicative of, future events or results.
Index Definitions
An investment in BREIT is not a direct investment in real estate, and has material differences from a direct investment in real estate, including those related to fees and expenses, liquidity and tax treatment. BREIT’s share price is subject to less volatility because its per share NAV is based on the value of real estate assets it owns and is not subject to market pricing forces as are the prices of the asset classes represented by the indices presented. Although BREIT’s share price is subject to less volatility, BREIT shares are significantly less liquid than these asset classes, and are not immune to fluctuations. Private real estate is not traded on an exchange and will have less liquidity and price transparency. The value of private real estate may fluctuate and may be worth less than was initially paid for it.
The volatility and risk profile of the indices presented is likely to be materially different from that of BREIT including those related to fees and expenses, liquidity, safety, and tax features. In addition, the indices employ different investment guidelines and criteria than BREIT; as a result, the holdings in BREIT may differ significantly from the holdings of the securities that comprise the indices. The indices are not subject to fees or expenses, are meant to illustrate general market performance and it may not be possible to invest in the indices. The performance of the indices has not been selected to represent an appropriate benchmark to compare to BREIT’s performance, but rather is disclosed to allow for comparison of BREIT’s performance to that of well-known and widely recognized indices. A summary of the investment guidelines for the indices presented is available upon request. In the case of equity indices, performance of the indices reflects the reinvestment of dividends.
BREIT does not trade on a national securities exchange, and therefore, is generally illiquid. Your ability to redeem shares in BREIT through BREIT’s share repurchase plan may be limited, and fees associated with the sale of these products can be higher than other asset classes. In some cases, periodic distributions may be subsidized by borrowed funds and include a return of investor principal. This is in contrast to the distributions investors receive from large corporate stocks that trade on national exchanges, which are typically derived solely from earnings. Investors typically seek income from distributions over a period of years. Upon liquidation, return of capital may be more or less than the original investment depending on the value of assets.
The MSCI U.S. REIT Index is a free float-adjusted market capitalization index that is comprised of equity REITs. The index is based on the MSCI USA Investable Market Index (IMI), its parent index, which captures large, mid and small cap securities. It represents about 99% of the U.S. REIT universe. The index is calculated with dividends reinvested on a daily basis. An investment in private real estate differs from the MSCI U.S. REIT Index in that private real estate investments are not publicly traded U.S. Equity REITs.
Forward-Looking Statements
This material contains forward-looking statements within the meaning of the federal securities laws and the Private Securities Litigation Reform Act of 1995. These forward-looking statements can be identified by the use of forward-looking terminology such as “outlook,” “indicator,” “believes,” “expects,” “potential,” “continues,” “identified,” “may,” “will,” “should,” “seeks,” “approximately,” “predicts,” “intends,” “plans,” “estimates,” “anticipates”, “confident,” “conviction” or other similar words or the negatives thereof. These may include financial estimates and their underlying assumptions, statements about plans, objectives, intentions, and expectations with respect to positioning, including the impact of macroeconomic trends and market forces, future operations, repurchases, acquisitions, future performance and statements regarding identified but not yet closed acquisitions. Such forward-looking statements are inherently subject to various risks and uncertainties. Accordingly, there are or will be important factors that could cause actual outcomes or results to differ materially from those indicated in such statements. We believe these factors include but are not limited to those described under the section entitled “Risk Factors” in BREIT’s prospectus and annual report for the most recent fiscal year, and any such updated factors included in BREIT’s periodic filings with the SEC, which are accessible on the SEC’s website at www.sec.gov. These factors should not be construed as exhaustive and should be read in conjunction with the other cautionary statements that are included in this document (or BREIT’s public filings). Except as otherwise required by federal securities laws, we undertake no obligation to publicly update or revise any forward-looking statements, whether as a result of new information, future developments or otherwise.
The following table reconciles GAAP net income (loss) to same property NOI for the nine months ended September 30, 2023 and 2022 ($ in thousands). Same property NOI growth for the nine months ended September 30, 2023 was 6%+.
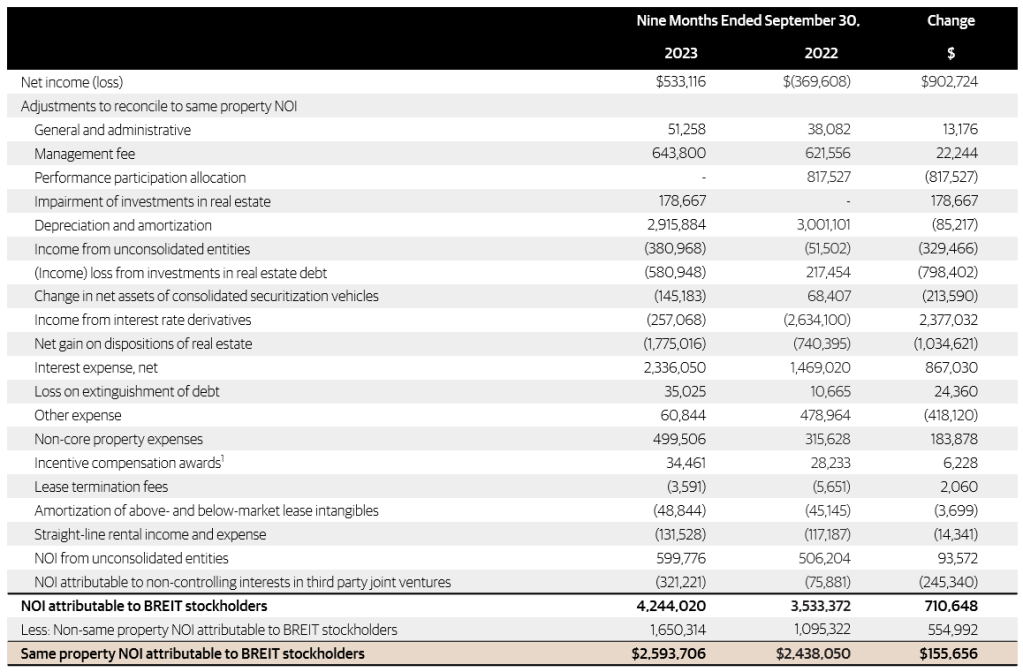
1Included in rental property operating and hospitality operating expense on our Condensed Consolidated Statements of Operations.
Note: See “Important Disclosure Information-Same Property NOI Growth”.