

2022 Year-End Stockholder Letter
2022 Year-End Stockholder Letter
January 26, 2023
Dear BREIT Stockholder,
We launched BREIT in 2017 with a simple goal in mind: to bring Blackstone Real Estate’s preeminent institutional platform to individual investors. We believe we have built an all-weather portfolio that has delivered attractive tax-advantaged distributions and capital appreciation. Amid a challenging investment environment and higher interest rates, BREIT generated an 8.4% net return last year, as well as a 12.5% annualized net return since inception six years ago, despite meaningfully widening exit cap rates (lowering valuation multiples).1,2 Additionally, BREIT’s 4.5% annualized distribution yield equates to a 7.1% tax-equivalent yield.3
Over the past six years, we have constructed a portfolio designed to benefit from secular and demographic tailwinds. We chose the right sectors and regions that we believe offer appreciation potential, avoided sectors that do not, and prudently managed our balance sheet. Our 2022 performance reflected these advantages. Approximately 70% of our portfolio is located in the fast-growing Sunbelt markets, where population, employment and wage growth significantly outpace the national average, boosting demand for rental properties.4,5,6,7 Around 80% of BREIT’s real estate holdings are concentrated in the rental housing and industrial sectors, where supply / demand fundamentals remain favorable: a structural shortage of housing has resulted in pricing power for rental housing assets, while steady e-commerce growth has generated demand from industrial tenants.4 This positioning of our portfolio resulted in strong estimated 13% cash flow growth in 2022 and we believe these tailwinds will continue.8 In fact, Green Street, a widely respected real estate research firm in the U.S., is forecasting rental housing and industrial cash flows for comparable publicly traded REITs in our largest sectors to grow 8% in 2023, exceeding both inflation and historical growth rates.9 In anticipation of rising interest rates, we also proactively locked in low rates on approximately 90% of our liabilities for more than six years, protecting the portfolio from rising debt costs while generating balance sheet gains, even as rates have risen materially.10,11,12 This combination of sector and geographic concentration along with prudent balance sheet management, has led to our significant 3x outperformance versus the publicly traded REIT index since BREIT’s inception.13
Notwithstanding our strong performance, we recognize that the investment environment has changed and have reflected this in our monthly valuation process and net asset value by widening our rental housing and industrial exit cap rates (lowering valuation multiples) by 15%.2 Despite this shift and elevated repurchase requests, we continued to actively manage our portfolio, investing more than $35 billion in new opportunities and completing or committing to sell assets worth more than $6 billion last year, which we sold in aggregate at a meaningful premium to our carrying values.14
We started the new year with a landmark $4.5 billion* investment in BREIT Class I common shares from The Office of the Chief Investment Officer of the Regents of the University of California. A commitment of this size by a highly sophisticated investor following a thorough due diligence process is, in our view, a tremendous affirmation of the quality of BREIT’s portfolio, asset values, and performance outlook. This investment provides meaningful capital during what we believe is an opportune deployment period and enhances BREIT’s balance sheet flexibility.
Manager selection is critical during periods of volatility and all real estate is not created equal. We believe our focus on our high conviction sectors rather than for-sale housing, commodity office assets or malls has supported BREIT’s performance in this challenging environment. BREIT benefits from Blackstone’s preeminent real estate business, 30+ year track record of successfully navigating market cycles and proprietary market insights from its position as the largest owner, buyer and seller of commercial real estate globally.15,16 As we look to 2023, we are excited about the opportunities ahead and remain confident in BREIT’s ability to continue to deliver strong performance.
Thank you for your continued confidence – we are grateful for the responsibility you have entrusted with us.

Frank Cohen
Chairman of the Board
& Chief Executive Officer

A.J. Agarwal
President & Director

Wesley LePatner
Chief Operating Officer & Director

Brian Kim
Head of Acquisitions and Capital Markets & Director
*Includes a $500 million investment expected to close March 1, 2023.
2022 Year in Review
Strong Cash Flow
13%
Estimated same property NOI growth – meaningfully higher than publicly traded REITs8,17
Investor Demand
$20.8B
Gross fundraising
Significant Deployment
$35B+
Invested in new opportunities, including two public-to-private transactions
Real Estate Portfolio Snapshot


* Rental Housing includes the following subsectors as a percent of Real Estate TAV: multifamily (36%, including affordable housing, which accounts for 8%), student housing (10%), single family rental housing (8%), manufactured housing (1%) and senior housing (<1%).
Download 2022 Year-End Stockholder Letter

Past performance does not guarantee future results. Financial data is estimated and unaudited. All figures as of December 31, 2022 unless otherwise noted. Opinions expressed reflect the current opinions of BREIT as of the date appearing in the materials only and are based on BREIT’s opinions of the current market environment, which is subject to change. Certain information contained in the materials discusses general market activity, industry or sector trends, or other broad-based economic, market or political conditions and should not be construed as research or investment advice.
- Represents Class I shares. Please refer to page 6 for performance for BREIT’s other share classes. Returns shown reflect the percent change in the NAV per share from the beginning of the applicable period, plus the amount of any distribution per share declared in the period. All returns shown assume reinvestment of distributions pursuant to BREIT’s distribution reinvestment plan, are derived from unaudited financial information, and are net of all BREIT expenses, including general and administrative expenses, transaction-related expenses, management fees, performance participation allocation, and share class-specific fees, but exclude the impact of early repurchase deductions on the repurchase of shares that have been outstanding for less than one year. The inception dates for the Class I, D, S and T shares are January 1, 2017, May 1, 2017, January 1, 2017 and June 1, 2017, respectively. 1-year and 3-year refer to the twelve and thirty-six months, respectively, ended December 31, 2022. The returns have been prepared using unaudited data and valuations of the underlying investments in BREIT’s portfolio, which are estimates of fair value and form the basis for BREIT’s NAV. Valuations based upon unaudited reports from the underlying investments may be subject to later adjustments, may not correspond to realized value and may not accurately reflect the price at which assets could be liquidated. As return information is calculated based on NAV, return information presented will be impacted should the assumptions on which NAV was determined prove to be different. Past performance is not necessarily indicative of future results. 3-year and inception to date (“ITD”) returns are annualized consistent with the IPA Practice Guideline 2018.
- Reflects the 15% increase in BREIT’s weighted average rental housing and industrial assumed exit cap rates from December 31, 2021 to December 31, 2022, weighted by BREIT’s asset value in each sector for the respective time period.
- Reflects Class I shares. Annualized distribution rates for all BREIT share classes can be found on page 6. Reflects the current month’s distribution annualized and divided by the prior month’s NAV, which is inclusive of all fees and expenses. All distribution rates shown are historical. Distributions are not guaranteed and may be funded from sources other than cash flow from operations, including borrowings, offering proceeds, the sale of our assets and repayments of our real estate debt investments. We have no limits on the amounts we may fund from such sources. As of September 30, 2022, 100% of inception to date distributions were funded from cash flows from operations. BREIT has delivered 70, 68, 70 and 67 months of consecutive distributions for the Class I, D, S and T shares, respectively. Tax-equivalent yield reflects the pre-tax yield an investor in a theoretical taxable investment would need to receive to match the +4.5% after-tax yield of BREIT’s Class I share class assuming that (i) all income earned on the theoretical fixed income investment is taxed at the top ordinary rate of 37% and (ii) 94% of BREIT’s distributions are treated as a return of capital (“ROC”), which is equal to the percentage of distributions classified as ROC for 2022, and excluding the impact of taxes that would be payable upon redemption. The ordinary income tax rate could change in the future. Tax-equivalent yield for the other share classes are as follows: Class D: +6.8%; Class S: +5.7%; and Class T: +5.8%. The tax-equivalent yield would be reduced by 1.4%, 1.3%, 1.1% and 1.1% for Class I, D, S and T shares, respectively, taking into account deferred capital gains tax that would be payable upon redemption. This assumes a one-year holding period and includes the impact of deferred capital gains tax incurred in connection with a redemption of BREIT shares. Upon redemption, an investor is assumed to be subject to tax on all prior return of capital distributions at the current maximum capital gains rate of 20%. The capital gains rate could change in the future. Other fixed income products with different characteristics, such as municipal bonds, may also provide tax advantages. The availability of certain tax benefits, such as tax losses from other investments, may also increase the after-tax yield of other fixed income products for an investor. Investors should consult their own tax advisors. See “Tax Information” above.
- Sunbelt represents the South and West regions as defined by the National Council of Real Estate Investment Fiduciaries (“NCREIF”). “Region Concentration” represents regions as defined by NCREIF and the weighting is measured as the asset value of real estate properties and unconsolidated property investments for each regional category (South, West, East, Midwest, Non-U.S.) divided by the total asset value of all (i) real estate properties, excluding the value of any third-party interests in such real estate properties, and (ii) unconsolidated property investments. “Non-U.S.” reflects investments in Europe and Canada. “Property Sector Concentration” weighting is measured as the asset value of real estate investments for each sector category (rental housing, industrial, net lease, data centers, hospitality, self storage, office, retail) divided by the total asset value of all real estate investments, excluding the value of any third-party interests in such real estate investments (“Real Estate TAV”). The following sectors each have subsectors comprising over 1.0% of Real Estate TAV. Rental housing: multifamily (36%, including affordable housing, which accounts for 8%), student housing (10%), single family rental housing (8%) and manufactured housing (1%); industrial: warehouses; and hospitality: select service hotels. Please see the prospectus for more information on BREIT’s investments.
- U.S. Bureau of Economic Analysis, as of June 22, 2022. Represents 5-year compound annual growth rate of population from mid-quarter Q1’17 to mid-quarter Q1’22.
- U.S. Bureau of Labor Statistics, as of September 16, 2022. Represents 5-year compound annual growth rate of seasonally adjusted employees on nonfarm payrolls from Aug. ‘17 to Aug. ’22.
- U.S. Bureau of Labor Statistics, as of August 24, 2022. Represents 5-year compound annual rate of employment-weighted average weekly wage from Q1’17 to Q1’22.
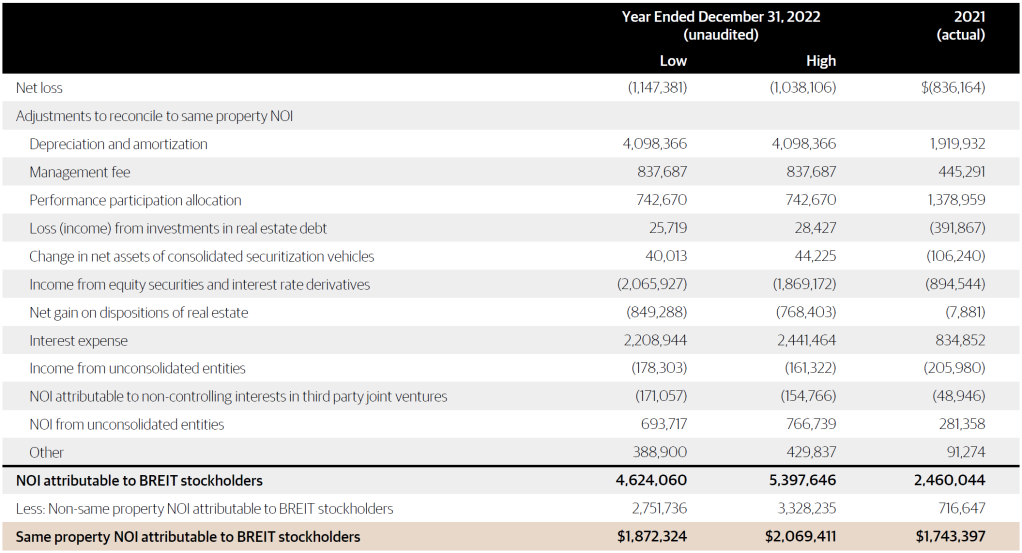
- Estimated Same Property NOI Growth. Represents BREIT’s preliminary estimated same property NOI growth for the year ended December 31, 2022 compared to the prior year (based on the midpoint of the preliminary estimated range of same property NOI). ) This data is not a comprehensive statement of our financial results for the year ended December 31, 2022, and our actual results may differ materially from this preliminary estimated data. Net Operating Income (“NOI”) is a supplemental non-generally accepted accounting principles (“GAAP”) measure of our property operating results that we believe is meaningful because it enables management to evaluate the impact of occupancy, rents, leasing activity and other controllable property operating results at our real estate. We define NOI as operating revenues less operating expenses, which exclude (i) impairment of investments in real estate, (ii) depreciation and amortization, (iii) straight-line rental income and expense, (iv) amortization of above- and below-market lease intangibles, (v) lease termination fees, (vi) property expenses not core to the operations of such properties, and (vii) other non-property related revenue and expense items such as (a) general and administrative expenses, (b) management fee paid to the Adviser, (c) performance participation allocation paid to the Special Limited Partner, (d) incentive compensation awards, (e) income (loss) from investments in real estate debt, (f) change in net assets of consolidated securitization vehicles, (g) income from equity securities and interest rate derivatives, (h) net gain (loss) on dispositions of real estate, (i) interest expense, (j) gain (loss) on extinguishment of debt, (k) other income (expense), and (l) similar adjustments for NOI attributable to non-controlling interests and unconsolidated entities. We evaluate our consolidated results of operations on a same property basis, which allows us to analyze our property operating results excluding acquisitions and dispositions during the periods under comparison. Properties in our portfolio are considered same property if they were owned for the full periods presented, otherwise they are considered non-same property. Recently developed properties are not included in same property results until the properties have achieved stabilization for both full periods presented. Properties held for sale, properties that are being re-developed, and interests in unconsolidated entities under contract of sale with hard deposit or other factors ensuring the buyer’s performance are excluded from same property results and are considered non-same property. We do not consider our investments in the real estate debt segment or equity securities to be same property. Estimated NOI margin is measured by dividing estimated same property NOI by estimated same property total revenues. For more information, please refer to BREIT’s Current Report on Form 8-K filed with the Securities and Exchange Commission on January 25, 2023 and the prospectus. Additionally, please refer to page 5 for a reconciliation of estimated GAAP net loss to same property NOI for the years ended December 31, 2022 and 2021.
- NOI growth is a property operating metric and a component of valuation but is not a comprehensive measure of operating results or indicative of BREIT’s performance. Green Street Advisors, latest sector updates available as of January 18, 2023. Multifamily publicly traded REIT same property NOI growth represented by Mid America Apartment Communities Inc. (“MAA”). Industrial publicly traded REIT same property NOI growth represented by Prologis. We believe MAA and Prologis are appropriate comparisons to BREIT’s multifamily and industrial sectors, respectively, based on their geographic concentration and asset quality. Historical growth rate reflects 20-year average rate of 3% and represents average annual growth from 2003 to 2022; 2022 represents the year-end estimate. There can be no assurance that publicly traded REIT NOI will grow as expected or that BREIT’s NOI will grow as expected or keep pace with any publicly traded REIT. Inflation reflects U.S. Bureau of Labor Statistics data and represents the Consumer Price Index, which measures changes in the prices paid by urban consumers for a representative basket of goods and services year-over-year as of December 31, 2022. NOI may not be correlated to or continue to keep pace with inflation.
- As of December 31, 2022. 88% fixed rate financing is measured by dividing (i) the sum of our consolidated fixed rate debt, secured financings on investments in real estate debt with matched underlying interest rate exposure, and the outstanding notional principal amount of corporate and consolidated interest rate swaps, by (ii) total consolidated debt outstanding. The use of leverage involves a high degree of financial risk and may increase the exposure of the investments to adverse economic factors.
- As of December 31, 2022. Low rates reflect BREIT’s 4.3% weighted average interest rate, which is measured as the weighted average interest rate of corporate and consolidated property debt, adjusted for BREIT’s corporate and consolidated property interest rate hedges, and excludes BREIT’s pro rata share of debt within its unconsolidated real estate investments. 6.5 years reflects the weighted average duration of fixed and swapped consolidated property level and entity level debt and excludes BREIT’s pro rata share of debt within its unconsolidated real estate investments.
- Reflects value increases from BREIT’s fixed rate liabilities and corporate and real estate interest rate hedges of $4.2 billion during the year ended December 31, 2022. Excludes value associated with floating rate debt and interest rate swaps against debt investments.
- Reflects BREIT’s Class I net return for the year and inception to date period ended December 31, 2022 of 8.4% and 12.5%, respectively, compared to total returns for publicly traded REITs of -24.5% in 2022 and 3.9% since BREIT’s inception. Publicly traded REITs represented by the MSCI U.S. REIT Index. The volatility and risk profile of the indices presented are likely to be materially different from that of BREIT including those related to fees and expenses, liquidity, safety, and tax features BREIT does not trade on a national securities exchange, and therefore, is generally illiquid. Your ability to redeem shares in BREIT through BREIT’s share repurchase plan may be limited and our board may make exceptions to, modify or suspend the plan In addition, the indices employ different investment guidelines and criteria than BREIT as a result, the holdings in BREIT may differ significantly from the holdings of the securities that comprise the indices The performance of the indices has not been selected to represent an appropriate benchmark to compare to BREIT’s performance, but rather is disclosed to allow for comparison of BREIT’s performance to that of well known and widely recognized indices. See Note 1 for more information on BREIT’s returns as well as “Index Definitions”.
- The amount of assets sold includes $0.6 billion of investments under contract. Reflects gross sales price. Premium represents the sale price of BREIT assets as of January 11, 2023 relative to BREIT’s gross asset carrying value (“GAV”) for those assets three months prior to the sale. Analysis excludes sales in our single family rental housing and affordable housing sectors where certain third parties including existing tenants and joint venture partners have certain buyout rights that may not be reflective of market value. There can be no assurance that dispositions under contract but not yet closed will close as expected or at all.
- MSCI Real Capital Analytics, as of December 31, 2022. World’s largest owner of commercial real estate reflects estimated market value. Largest buyer and seller reflect transaction volume since January 1, 2010.
- The real estate group of Blackstone Inc. (“Blackstone”), Blackstone Real Estate, is our sponsor and an affiliate of our advisor. Information regarding Blackstone and Blackstone Real Estate is included to provide information regarding the experience of our sponsor and its affiliates. An investment in BREIT is not an investment in Blackstone as BREIT is a separate and distinct legal entity. Past performance does not guarantee future results. There can be no assurance that any Blackstone fund or investment will achieve its objectives or avoid substantial losses.
- Publicly traded REITs reflect NAREIT Total REIT Industry Tracker data and represent year-over-year same property NOI growth for the nine months ended September 30, 2022 based on latest available data. See “Index Definitions”.
Important Disclosure Information
Blackstone Proprietary Data. Certain information and data provided herein is based on Blackstone proprietary knowledge and data. Portfolio companies may provide proprietary market data to Blackstone, including about local market supply and demand conditions, current market rents and operating expenses, capital expenditures and valuations for multiple assets. Such proprietary market data is used by Blackstone to evaluate market trends as well as to underwrite potential and existing investments. While Blackstone currently believes that such information is reliable for purposes used herein, it is subject to change, and reflects Blackstone’s opinion as to whether the amount, nature and quality of the data is sufficient for the applicable conclusion, and no representations are made as to the accuracy or completeness thereof.
Select Images. The selected images of certain BREIT investments in this presentation are provided for illustrative purposes only, are not representative of all BREIT investments of a given property type and are not representative of BREIT’s entire portfolio. It should not be assumed that BREIT’s investment in the properties identified and discussed herein were or will be profitable. Please refer to https://www.breit.com/properties for a complete list of BREIT’s real estate investments (excluding equity in public and private real estate related companies).
Tax Information. The tax information herein is provided for informational purposes only, is subject to material change, and should not be relied upon as a guarantee or prediction of tax effects. This material also does not constitute tax advice to, and should not be relied upon by, potential investors, who should consult their own tax advisors regarding the matters discussed herein and the tax consequences of an investment. A portion of REIT ordinary income distributions may be tax deferred given the ability to characterize ordinary income as Return of Capital (“ROC”). ROC distributions reduce the stockholder’s tax basis in the year the distribution is received, and generally defer taxes on that portion until the stockholder’s stock is sold via redemption. Upon redemption, the investor may be subject to higher capital gains taxes as a result of a lower cost basis due to the return of capital distributions. Certain non-cash deductions, such as depreciation and amortization, lower the taxable income for REIT distributions. Investors should be aware that a REIT’s Return of Capital (ROC) percentage may vary significantly in a given year and, as a result, the impact of the tax law and any related advantages may vary significantly from year to year. While we currently believe that the estimations and assumptions referenced herein are reasonable under the circumstances, there is no guarantee that the conditions upon which such assumptions are based will materialize or are otherwise applicable. This information does not constitute a forecast, and all assumptions herein are subject to uncertainties, changes and other risks, any of which may cause the relevant actual, financial and other results to be materially different from the results expressed or implied by the information presented herein. No assurance, representation or warranty is made by any person that any of the estimations herein will be achieved, and no recipient of this example should rely on such estimations. Investors may also be subject to net investment income taxes of 3.8% and/or state income tax in their state of residence which would lower the after-tax yield received by the investor.
Trends. There can be no assurances that any of the trends described herein will continue or will not reverse. Past events and trends do not imply, predict or guarantee, and are not necessarily indicative of, future events or results.
Index Definitions. An investment in BREIT is not a direct investment in real estate, and has material differences from a direct investment in real estate, including those related to fees and expenses, liquidity and tax treatment. BREIT’s share price is subject to less volatility because its per share NAV is based on the value of real estate assets it owns and is not subject to market pricing forces as are the prices of investment-grade bonds, municipal bonds, listed REITs or equities. Although BREIT’s share price is subject to less volatility, BREIT shares are significantly less liquid than these asset classes, and are not immune to fluctuations. Private real estate is not traded on an exchange and will have less liquidity and price transparency. The value of private real estate may fluctuate and may be worth less than was initially paid for it.
The volatility and risk profile of the indices presented is likely to be materially different from that of BREIT including those related to fees and expenses, liquidity, safety, and tax features. In addition, the indices employ different investment guidelines and criteria than BREIT; as a result, the holdings in BREIT may differ significantly from the holdings of the securities that comprise the indices. The indices are not subject to fees or expenses, are meant to illustrate general market performance and it may not be possible to invest in the indices. The performance of the indices has not been selected to represent an appropriate benchmark to compare to BREIT’s performance, but rather is disclosed to allow for comparison of BREIT’s performance to that of well-known and widely recognized indices. A summary of the investment guidelines for the indices presented are available upon request. In the case of equity indices, performance of the indices reflects the reinvestment of dividends.
BREIT does not trade on a national securities exchange, and therefore, is generally illiquid. Your ability to redeem shares in BREIT through BREIT’s share repurchase plan may be limited and fees associated with the sale of these products can be higher than other asset classes. In some cases, periodic distributions may be subsidized by borrowed funds and include a return of investor principal. This is in contrast to the distributions investors receive from large corporate stocks that trade on national exchanges, which are typically derived solely from earnings. Investors typically seek income from distributions over a period of years. Upon liquidation, return of capital may be more or less than the original investment depending on the value of assets.
An investment in BREIT has material differences from an investment in Treasury notes, investment grade bonds, municipal bonds and publicly traded REIT shares, including, among other things, those related to costs and expenses, liquidity, volatility, risk profile and tax treatment. Unlike BREIT shareholders, holders of bonds do not hold an ownership interest in the issuer. The purchase price of BREIT shares is generally the prior month’s NAV per share for the applicable class, plus upfront selling commissions and dealer manager fees for Class D, S and T shares. Such share classes are also subject to stockholder servicing fees. While the liquidity of a Treasury note, investment grade bond, municipal bond and publicly traded REIT share depends on its credit rating and market conditions, there generally exists a secondary market for such instruments. There is no public trading market for shares of BREIT and an investor’s ability to dispose of shares will likely be limited to repurchase by us, subject to the limitations described in BREIT’s prospectus. The volatility and risk profile of such bonds is also likely to be materially different from that of BREIT because, among other things, BREIT’s shares are not fixed-rate debt instruments and such bonds represent debt issued by the Treasury Department, corporations across a variety of issuers and municipalities, respectively, with varying pricing, terms and conditions. BREIT’s share price may be subject to less volatility because its per share NAV is based on the value of real estate assets it owns and is not subject to market pricing forces in the same way as are the prices of bonds, but is not immune to fluctuations. The foregoing types of bonds bear a contractual interest rate and in the case of investment grade bonds are rated investment grade, whereas BREIT’s yield is generated primarily by rental income, including leases that are short-term, and these rental obligations are not rated. Furthermore, issuers of bonds are contractually obligated to pay periodic interest and repay a fixed principal amount at maturity, whereas we cannot guarantee that we will make any distributions and investing in BREIT involves a high degree of risk, as described in BREIT’s prospectus.
An investment in private real estate differs from the MSCI U.S. REIT Index and the NAREIT Total REIT Industry Tracker in that private real estate investments are not publicly traded U.S. Equity REITs.
- The MSCI U.S. REIT Index is a free float-adjusted market capitalization index that is comprised of equity REITs. The index is based on the MSCI USA Investable Market Index (IMI), its parent index, which captures large, mid and small cap securities. It represents about 99% of the U.S. REIT universe. The index is calculated with dividends reinvested on a daily basis.
- The NAREIT Total REIT Industry Tracker is a quarterly composite performance measure of the entire U.S. stock exchange-listed REIT industry. The NAREIT NOI Tracker reports Net Operating Income for all publicly traded equity REITs.
Summary of Risk Factors
BREIT is a non-listed REIT that invests primarily in stabilized income-generating commercial real estate investments across asset classes in the United States (“U.S.”) and, to a lesser extent, real estate debt investments, with a focus on current income. We invest to a lesser extent in countries outside of the U.S. This investment involves a high degree of risk. You should purchase these securities only if you can afford the complete loss of your investment. You should read the prospectus carefully for a description of the risks associated with an investment in BREIT. These risks include, but are not limited to, the following:
- Since there is no public trading market for our common stock, repurchase of shares by us will likely be the only way to dispose of your shares. Our share repurchase plan, which is approved and administered by our board of directors, provides stockholders with the opportunity to request that we repurchase their shares on a monthly basis, but we are not obligated to repurchase any shares and our board of directors may determine to repurchase only some, or even none, of the shares that have been requested to be repurchased in any particular month in its discretion. In addition, repurchases will be subject to available liquidity and other significant restrictions, including repurchase limitations that have in the past been, and may in the future be, exceeded, resulting in our repurchase of shares on a pro rata basis. Further, our board of directors may, in certain circumstances, make exceptions to, modify or suspend our share repurchase plan. As a result, our shares should be considered as having only limited liquidity and at times may be illiquid.
- Distributions are not guaranteed and may be funded from sources other than cash flow from operations, including, without limitation, borrowings, the sale of our assets, repayments of our real estate debt investments, return of capital or offering proceeds, and advances or the deferral of fees and expenses. We have no limits on the amounts we may fund from such sources.
- The purchase and repurchase price for shares of our common stock are generally based on our prior month’s net asset value (“NAV”) and are not based on any public trading market. While there will be independent annual appraisals of our properties, the appraisal of properties is inherently subjective, and our NAV may not accurately reflect the actual price at which our properties could be liquidated on any given day.
- We are dependent on BX REIT Advisors L.L.C. (the “Adviser”) to conduct our operations, as well as the persons and firms the Adviser retains to provide services on our behalf. The Adviser will face conflicts of interest as a result of, among other things, the allocation of investment opportunities among us and Other Blackstone Accounts (as defined in BREIT’s prospectus), the allocation of time of its investment professionals and the substantial fees that we will pay to the Adviser.
- On acquiring shares, an investor will experience immediate dilution in the net tangible book value of the investor’s investment.
- There are limits on the ownership and transferability of our shares.
- We intend to continue to qualify as a REIT for U.S. federal income tax purposes. However, if we fail to qualify as a REIT and no relief provisions apply, our NAV and cash available for distribution to our stockholders could materially decrease.
- We do not own the Blackstone name, but we are permitted to use it as part of our corporate name pursuant to a trademark license agreement with an affiliate of Blackstone Inc. (“Blackstone”). Use of the name by other parties or the termination of our trademark license agreement may harm our business.
- The acquisition of investment properties may be financed in substantial part by borrowing, which increases our exposure to loss. The use of leverage involves a high degree of financial risk and will increase the exposure of our investments to adverse economic factors such as rising interest rates, downturns in the economy or deteriorations in the condition of our investments.
- Investing in commercial real estate assets involves certain risks, including but not limited to: adverse changes in values or operating results caused by global and national economic and market conditions generally and by the local economic conditions where our properties are located, including changes with respect to rising vacancy rates or decreasing market rental rates; tenants’ inability to pay rent; increases in interest rates and lack of availability of financing; tenant turnover and vacancies; and changes in supply of or demand for similar properties in a given market.
- Our portfolio is currently concentrated in certain industries and geographies, and, as a consequence, our aggregate return may be substantially affected by adverse economic or business conditions affecting that particular type of asset or geography.
- Local, regional, or global events such as war (e.g., Russia/Ukraine), acts of terrorism, public health issues like pandemics or epidemics (e.g., COVID-19), recessions, or other economic, political and global macro factors and events could lead to a substantial economic downturn or recession in the U.S. and global economies and have a significant impact on BREIT and its investments. The recovery from such downturns is uncertain and may last for an extended period of time or result in significant volatility, and many of the risks discussed herein associated with an investment in BREIT may be increased.
Certain information contained in this material has been obtained from sources outside Blackstone, which in certain cases has not been updated through the date hereof. While such information is believed to be reliable for purposes used herein, no representations are made as to the accuracy or completeness thereof and none of Blackstone, its funds, nor any of their affiliates takes any responsibility for, and has not independently verified, any such information. This information involves a number of assumptions and limitations, and you are cautioned not to give undue weight to these estimates.
Opinions expressed reflect the current opinions of BREIT as of the date appearing in the materials only and are based on BREIT’s opinions of the current market environment, which is subject to change. Stockholders, financial professionals and prospective investors should not rely solely upon the information presented when making an investment decision and should review the most recent prospectus, as supplemented, available at www.breit.com. Certain information contained in the materials discusses general market activity, industry or sector trends, or other broad-based economic, market or political conditions and should not be construed as research or investment advice.
All rights to the trademarks and/or logos presented herein belong to their respective owners and Blackstone’s use hereof does not imply an affiliation with, or endorsement by, the owners of these logos.
Clarity of text on this website may be affected by the size of the screen on which it is displayed.
Forward-Looking Statements
This website contains “forward-looking statements” within the meaning of the federal securities laws and the Private Securities Litigation Reform Act of 1995. These forward-looking statements can be identified by the use of forward-looking terminology such as “outlook,” “indicator,” “believes,” “expects,” “potential,” “continues,” “identified,” “may,” “will,” “should,” “seeks,” “approximately,” “predicts,” “intends,” “plans,” “estimates,” “anticipates”, “confident,” “conviction” or other similar words or the negatives thereof. These may include financial estimates and their underlying assumptions, statements about plans, objectives, intentions, and expectations with respect to positioning, including the impact of macroeconomic trends and market forces, future operations, repurchases, acquisitions, future performance and statements regarding identified but not yet closed acquisitions. Such forward-looking statements are inherently subject to various risks and uncertainties. Accordingly, there are or will be important factors that could cause actual outcomes or results to differ materially from those indicated in such statements. We believe these factors include but are not limited to those described under the section entitled “Risk Factors” in BREIT’s prospectus and annual report for the most recent fiscal year, and any such updated factors included in BREIT’s periodic filings with the SEC, which are accessible on the SEC’s website at www.sec.gov. These factors should not be construed as exhaustive and should be read in conjunction with the other cautionary statements that are included in this document (or BREIT’s public filings). Except as otherwise required by federal securities laws, we undertake no obligation to publicly update or revise any forward-looking statements, whether as a result of new information, future developments or otherwise.
Blackstone Securities Partners L.P. (“BSP”) is a broker-dealer whose purpose is to distribute Blackstone managed or affiliated products. BSP provides services to its Blackstone affiliates, not to investors in its funds, strategies or other products. BSP does not make any recommendation regarding, and will not monitor, any investment. As such, when BSP presents an investment strategy or product to an investor, BSP does not collect the information necessary to determine—and BSP does not engage in a determination regarding—whether an investment in the strategy or product is in the best interests of, or is suitable for, the investor. You should exercise your own judgment and/or consult with a professional advisor to determine whether it is advisable for you to invest in any Blackstone strategy or product. Please note that BSP may not provide the kinds of financial services that you might expect from another financial intermediary, such as overseeing any brokerage or similar account. For financial advice relating to an investment in any Blackstone strategy or product, contact your own professional advisor.
This website must be read in conjunction with BREIT’s prospectus in order to fully understand all the implications and risks of an investment in BREIT. Please refer to the prospectus for more information regarding state suitability standards and consult a financial professional for share class availability and appropriateness.
THIS IS NEITHER AN OFFER TO SELL NOR A SOLICITATION OF AN OFFER TO BUY THE SECURITIES DESCRIBED IN THE PROSPECTUS FOR THE OFFERING, AS AMENDED AND SUPPLEMENTED (THE “PROSPECTUS”). THE OFFERING IS MADE ONLY BY THE PROSPECTUS AND THIS MATERIAL MUST BE PRECEDED OR ACCOMPANIED BY THE PROSPECTUS. NEITHER THE SECURITIES AND EXCHANGE COMMISSION NOR ANY OTHER STATE SECURITIES REGULATOR HAS APPROVED OR DISAPPROVED OF THE SECURITIES OR DETERMINED IF THE PROSPECTUS IS TRUTHFUL OR COMPLETE. IN ADDITION, THE ATTORNEY GENERAL OF THE STATE OF NEW YORK HAS NOT PASSED ON OR ENDORSED THE MERITS OF THE OFFERING. ANY REPRESENTATION TO THE CONTRARY IS UNLAWFUL.
The following table reconciles preliminary estimated GAAP net loss to same property NOI for the year ended December 31, 2022 and 2021 ($ in thousands). Same property NOI growth is estimated to be 13% for the year ended December 31, 2022 based on the midpoint of the estimated year-over-year increase.
Performance Summary
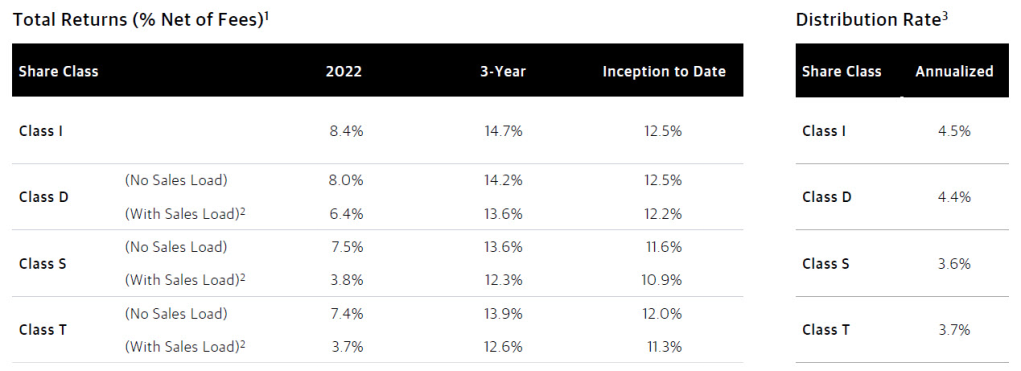
- Please refer to Note 1 on page 3 for more information on BREIT’s returns.
- Assumes payment of the full upfront sales charge at initial subscription (1.5% for Class D shares; 3.5% for Class S and Class T shares).
- Please refer to Note 3 on page 3 for more information BREIT’s annualized distribution rates.